This article has 2 errata:
[https://doi.org/10.1051/0004-6361/202039217]
[https://doi.org/10.1051/0004-6361/201832698e]
Fig. 11
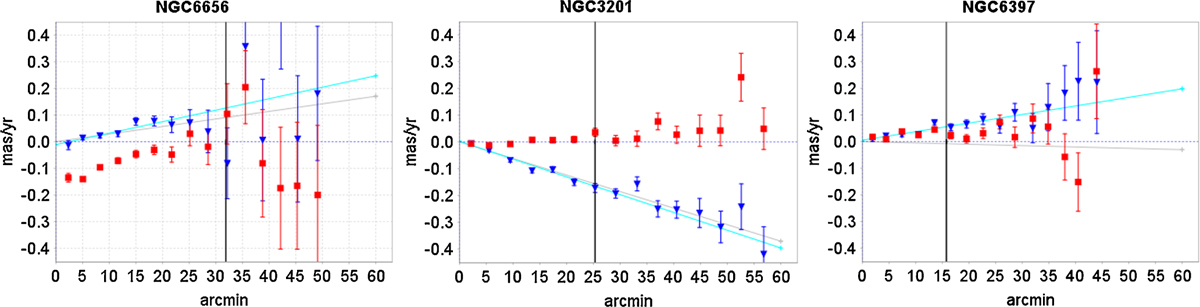
PM “systematics” in radial (blue triangles) and transverse (red squares) directions, as a function of distance to the cluster centre. The cyan line is a fit to the variation of the mean radial component of the PMs as a function of distance, while the grey line is the expected trend resulting from perspective contraction or expansion. From left to right: NGC 6656 shows a strong rotation signal as well as perspective expansion; NGC 3201 shows no rotation but very strong perspective contraction; and NGC 6397 shows halo expansion associated with core collapse, clearly different from the signal expected from the small perspective contraction. The vertical line indicates the tidal radius of the cluster reported in Harris10.
Current usage metrics show cumulative count of Article Views (full-text article views including HTML views, PDF and ePub downloads, according to the available data) and Abstracts Views on Vision4Press platform.
Data correspond to usage on the plateform after 2015. The current usage metrics is available 48-96 hours after online publication and is updated daily on week days.
Initial download of the metrics may take a while.