This article has 2 errata:
[https://doi.org/10.1051/0004-6361/202039217]
[https://doi.org/10.1051/0004-6361/201832698e]
Fig. 16
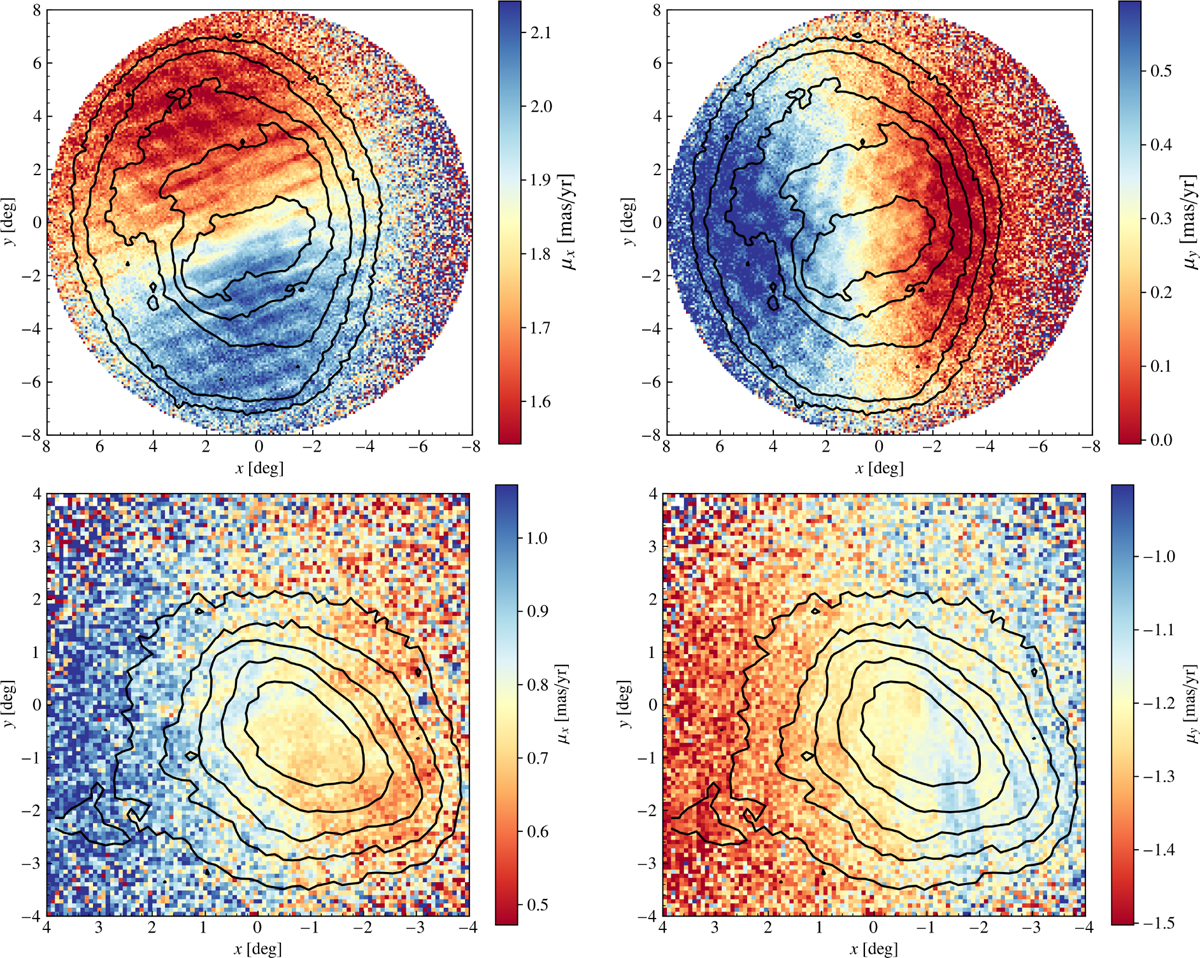
PMs of stars in the LMC (upper) and SMC (lower) showing the components μx (left) and μy (right), which are described in the text (Eq. (3)). The colour shows the median PM in each pixel (after filtering). The black density contours are logarithmically spaced, such that the outermost contour is at a source density 100 times lower than the highest density. The centre of each colour bar is chosen to be the median PM of all sources. This is not the same as the PM derived for the clouds below, because the sources are not distributed symmetrically around the assumed dynamical centre; the photometric and dynamical (from the HI disc) centres are offset from one another. Trends in PM, particularly the trend associated with rotation in the LMC, are clearly visible. The banding associated with the Gaia scanning law, and as seen in the parallaxes, are clearly visible as well.
Current usage metrics show cumulative count of Article Views (full-text article views including HTML views, PDF and ePub downloads, according to the available data) and Abstracts Views on Vision4Press platform.
Data correspond to usage on the plateform after 2015. The current usage metrics is available 48-96 hours after online publication and is updated daily on week days.
Initial download of the metrics may take a while.