This article has 2 errata:
[https://doi.org/10.1051/0004-6361/202039217]
[https://doi.org/10.1051/0004-6361/201832698e]
Fig. 17
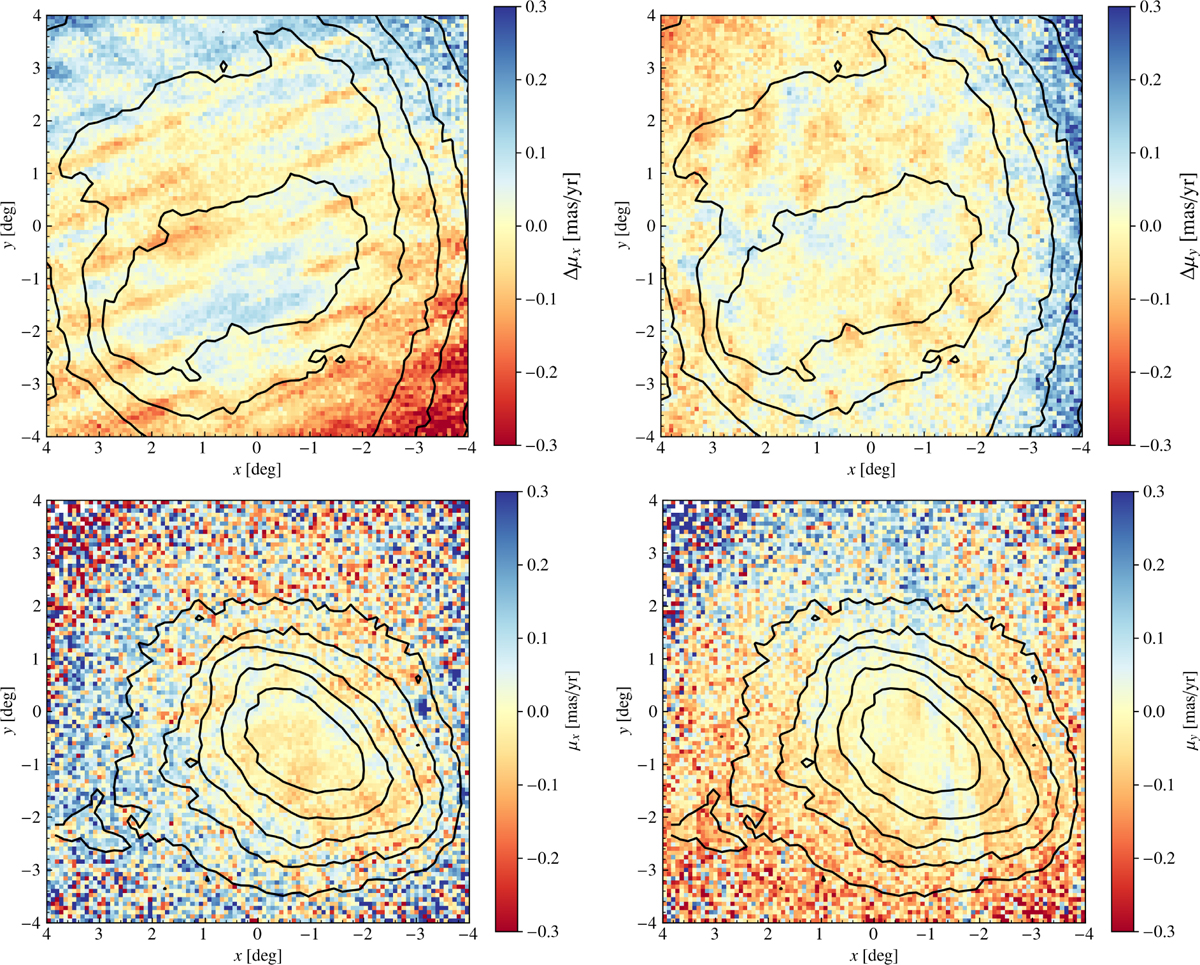
Residual PM, after subtraction of a model PM field for the LMC (top) and the SMC (bottom). For both objects, the majority of the variation disappears, and the banding in PM is more clearly visible. Black density contours are spaced in the same way as in Fig. 16. For the LMC, the imprint of orbits on the bar can be seen as the bluer area on the lower side of the bar (as it appears in the plot) and the redder areaon the upper side of the bar. The model that is subtracted is fit from sources within angular radii ρmax = 3° of the centre for the LMC, and ρmax = 2° of the centre for the SMC.
Current usage metrics show cumulative count of Article Views (full-text article views including HTML views, PDF and ePub downloads, according to the available data) and Abstracts Views on Vision4Press platform.
Data correspond to usage on the plateform after 2015. The current usage metrics is available 48-96 hours after online publication and is updated daily on week days.
Initial download of the metrics may take a while.