This article has 2 errata:
[https://doi.org/10.1051/0004-6361/202039217]
[https://doi.org/10.1051/0004-6361/201832698e]
Fig. 19
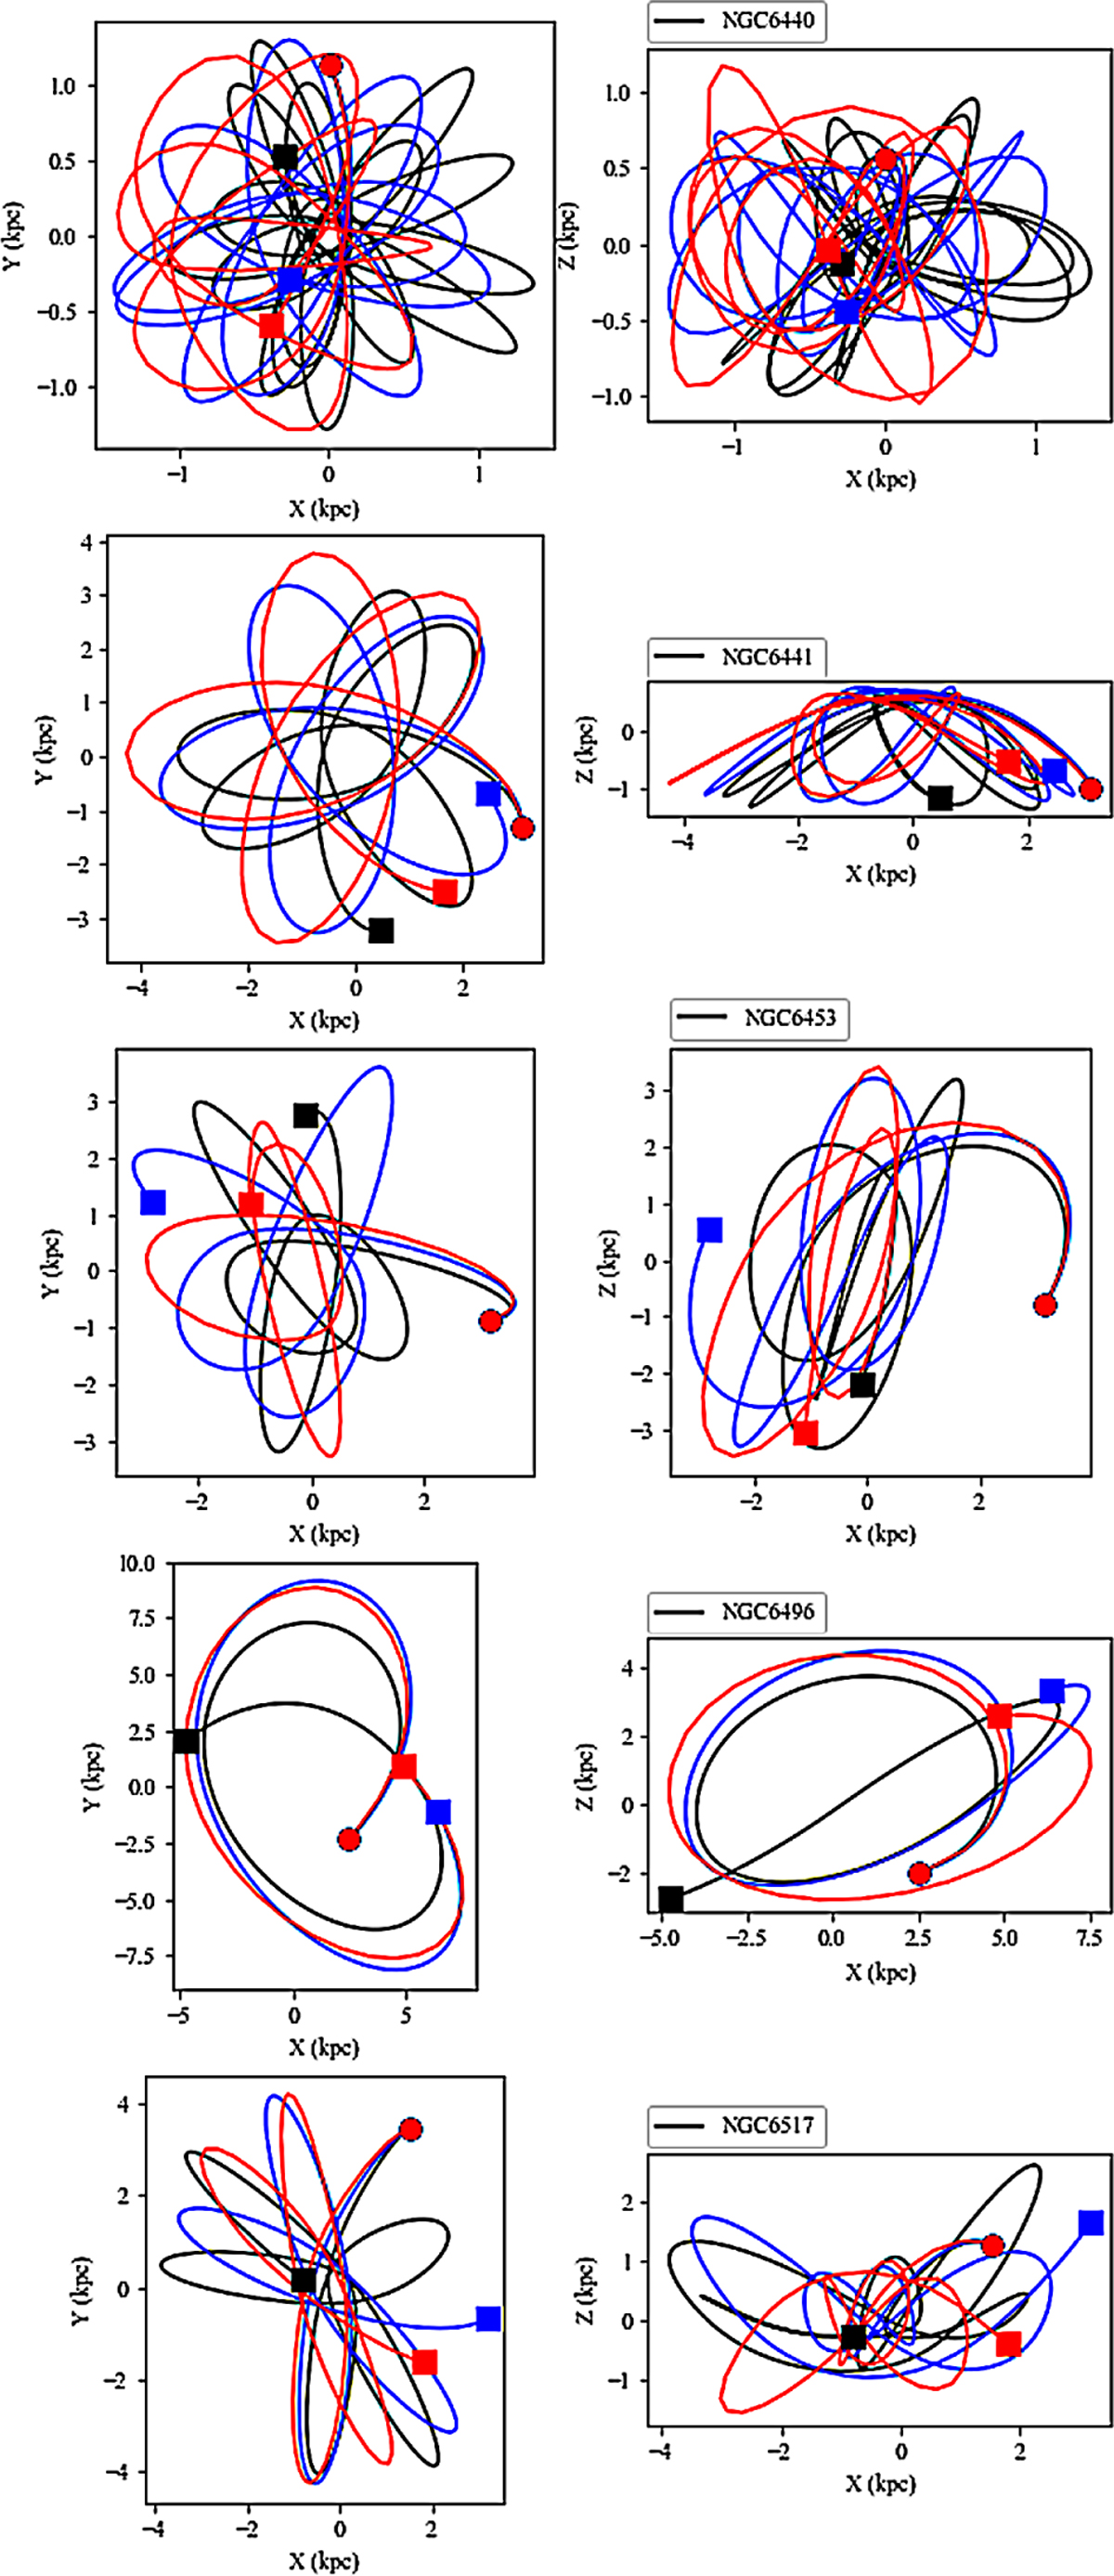
Examples of the orbits of some of the globular clusters in our sample. The different colours correspond to the different potentials: Model-1 (based on McMillan 2017, in blue), Model-2 (based on Allen & Santillan 1991, in black), and Model-3 (based on Robin et al. 2003, 2012, in red). The orbits of clusters that remain in the inner few kpc are quite different for the various potentials, while as expected, the differences are much smaller for those that have pericentres greater than ~ 2 kpc (e.g. NGC6496, fourth row). In these cases, the location of streams, if present, can be predicted much more reliably.
Current usage metrics show cumulative count of Article Views (full-text article views including HTML views, PDF and ePub downloads, according to the available data) and Abstracts Views on Vision4Press platform.
Data correspond to usage on the plateform after 2015. The current usage metrics is available 48-96 hours after online publication and is updated daily on week days.
Initial download of the metrics may take a while.