This article has 2 errata:
[https://doi.org/10.1051/0004-6361/202039217]
[https://doi.org/10.1051/0004-6361/201832698e]
Fig. 22
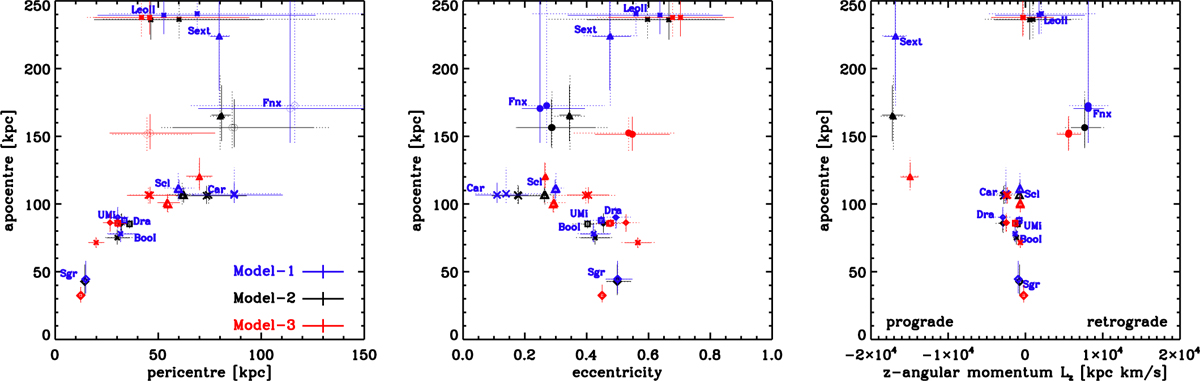
Distribution of orbital parameters for the dSph. The different colours indicate computations with different potentials. The agreement is generally good, with Model-3 systematically leading to smaller pericentres as a result of its higher mass at the radii probed by the systems. Larger differences are found for the more distant objects, revealing the sensitivity of their orbits to variations in the assumed mass distributions for the Galaxy. The dSph eccentricity distribution differs from that shown in Fig. 20 for the globular clusters in our sample. The symbols with solid error bars correspond to the median and uncertainties derived using the Monte Carlo realisations, and those with dotted error bars also take a systematic error of 0.035 mas yr−1 on each of the PM components into account.
Current usage metrics show cumulative count of Article Views (full-text article views including HTML views, PDF and ePub downloads, according to the available data) and Abstracts Views on Vision4Press platform.
Data correspond to usage on the plateform after 2015. The current usage metrics is available 48-96 hours after online publication and is updated daily on week days.
Initial download of the metrics may take a while.