This article has 2 errata:
[https://doi.org/10.1051/0004-6361/202039217]
[https://doi.org/10.1051/0004-6361/201832698e]
Fig. A.4
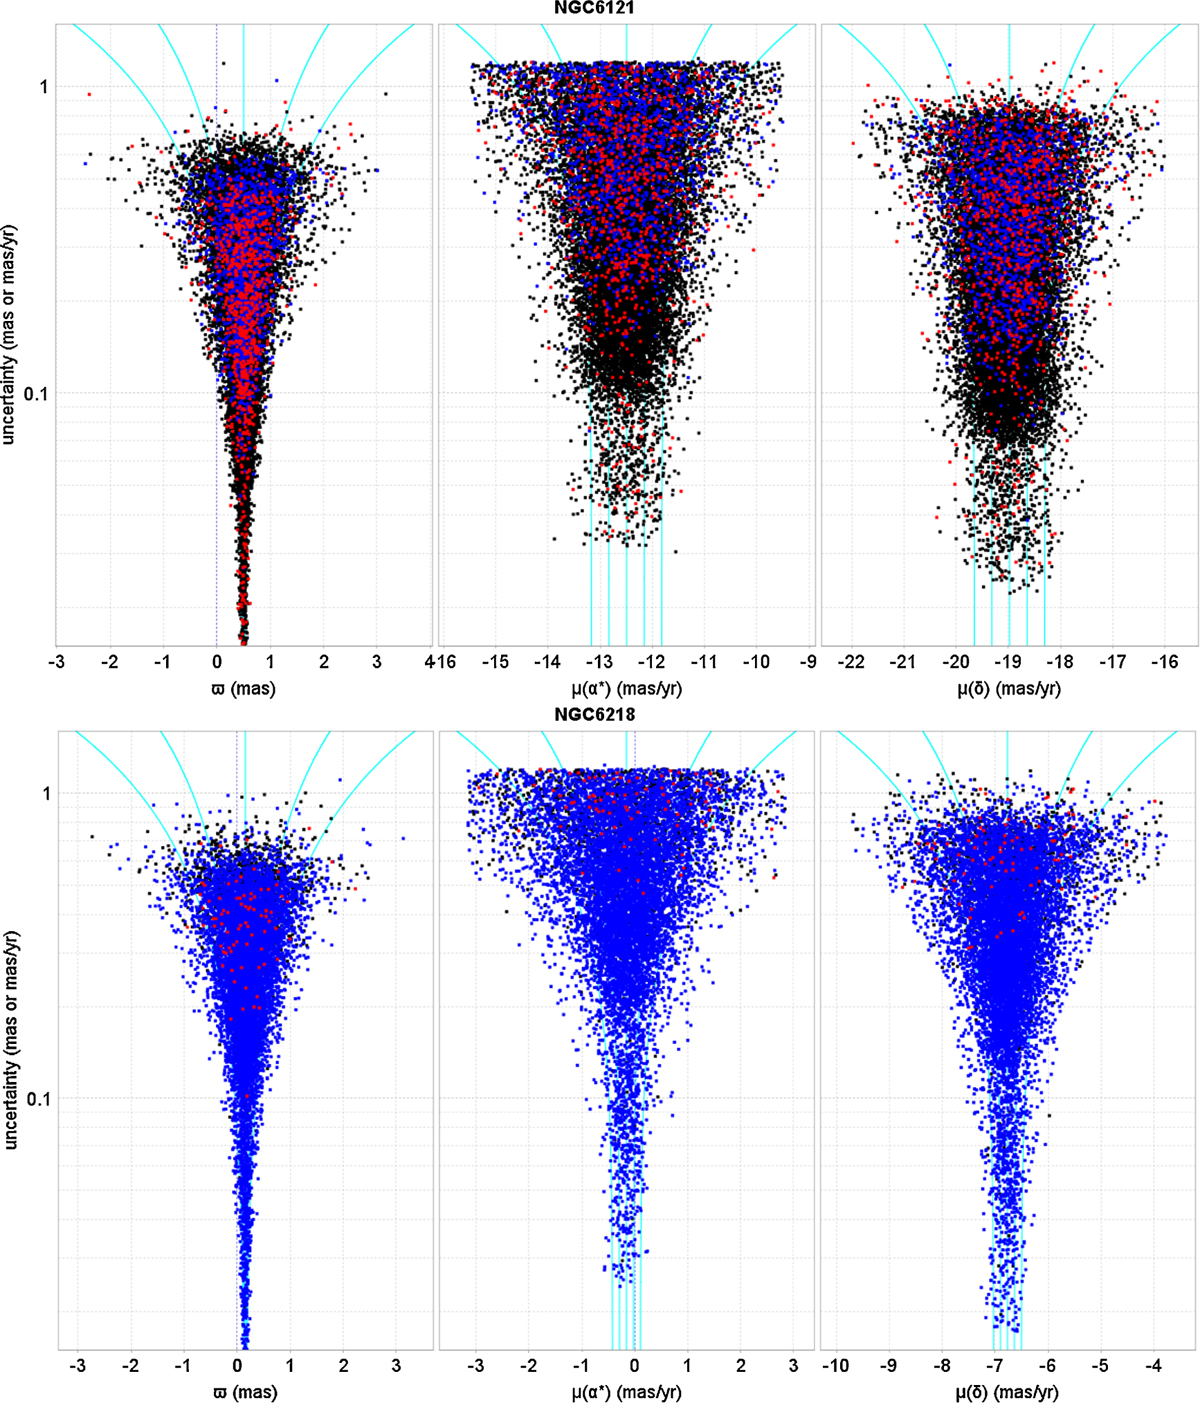
Two examples of the parallax and PM dispersion diagrams for clusters at a distance of approximately 2 (top) and 5 (bottom) kpc. The parallax and PMs are plotted against the standard uncertainties. The blue lines show the expected uncertainty levels relative to the mean value at –2, –1 0 1 and 2 σ, including noise contributions from the internal velocity dispersion and the dispersion of the parallaxes from the depth of the cluster. At low levels of standard uncertainty, the contributions from the internal dispersion are easily detected. The colouring ofthe data points reflects the error correlations: red means strongly negative, blue means strongly positive, and black means low.
Current usage metrics show cumulative count of Article Views (full-text article views including HTML views, PDF and ePub downloads, according to the available data) and Abstracts Views on Vision4Press platform.
Data correspond to usage on the plateform after 2015. The current usage metrics is available 48-96 hours after online publication and is updated daily on week days.
Initial download of the metrics may take a while.