Free Access
This article has 2 errata:
[https://doi.org/10.1051/0004-6361/202039217]
[https://doi.org/10.1051/0004-6361/201832698e]
Fig. 4
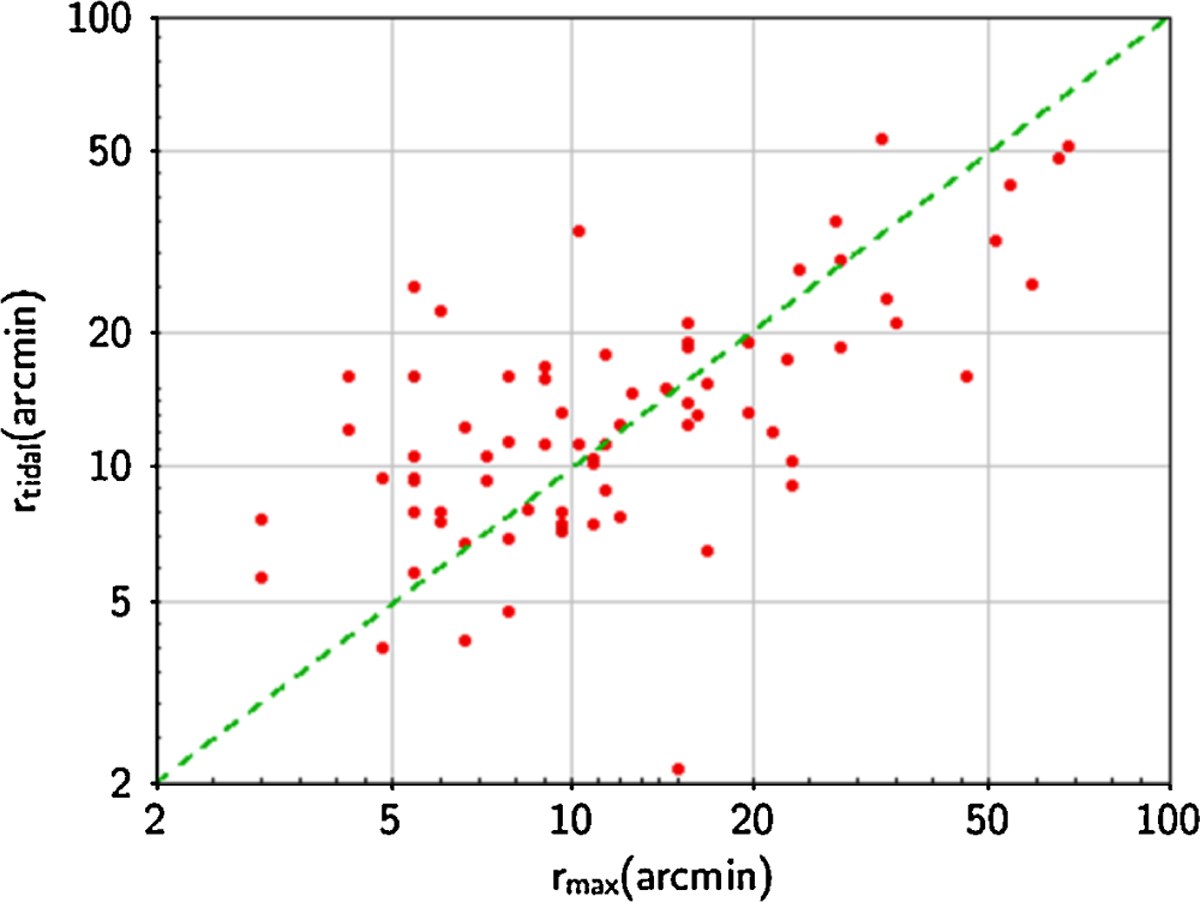
Comparison between the tidal radii rt (according to Harris10) of the 75 globular clusters in our sample and the maximum radii at which we have been able to detect cluster members in the present study. The diagonal line represents the one-to-one relation.
Current usage metrics show cumulative count of Article Views (full-text article views including HTML views, PDF and ePub downloads, according to the available data) and Abstracts Views on Vision4Press platform.
Data correspond to usage on the plateform after 2015. The current usage metrics is available 48-96 hours after online publication and is updated daily on week days.
Initial download of the metrics may take a while.