Fig. 6
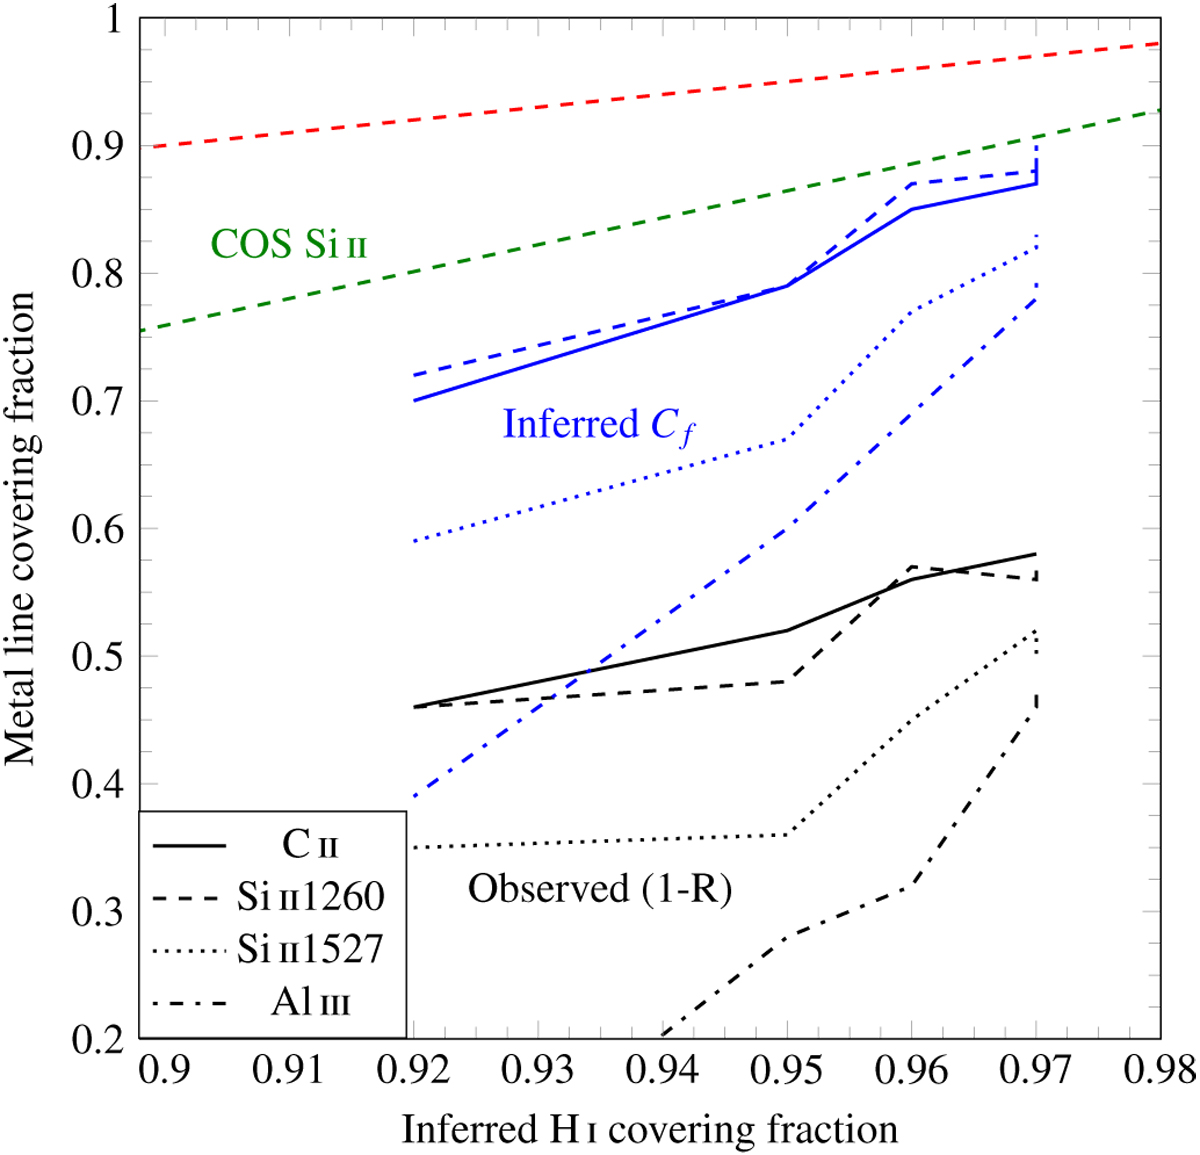
Metal covering fractions from Si II, C II, and Al III (as given by the line types in the legend) as a function of the H I covering fraction (Cf(H I)) from Reddy et al. (2016b). Cf(H I) is always measured in a clumpy geometry. The black lines show 1–R measured from the dereddened stellar continuum normalized stacks. This assumes a clumpy geometry with a uniform dust screen. The blue lines show when the Cf (metal) is derived in the same geometry as Cf(H I). When calculated with consistent geometries, Cf(Si II 1260 Å) (blue dashedline) is offset from Cf(H I) by a similaramount as our observations in Fig. 4. The green dashed line shows our fitted relationship between Cf(Si II) and Cf (H I) from Fig. 4, after converting it to clumpy geometry. The Reddy et al. (2016b) Cf (H I)–Cf(Si II) relationship is consistent, within the errors, with ours. The red dashed line shows a one-to-one relation.
Current usage metrics show cumulative count of Article Views (full-text article views including HTML views, PDF and ePub downloads, according to the available data) and Abstracts Views on Vision4Press platform.
Data correspond to usage on the plateform after 2015. The current usage metrics is available 48-96 hours after online publication and is updated daily on week days.
Initial download of the metrics may take a while.