Fig. 1
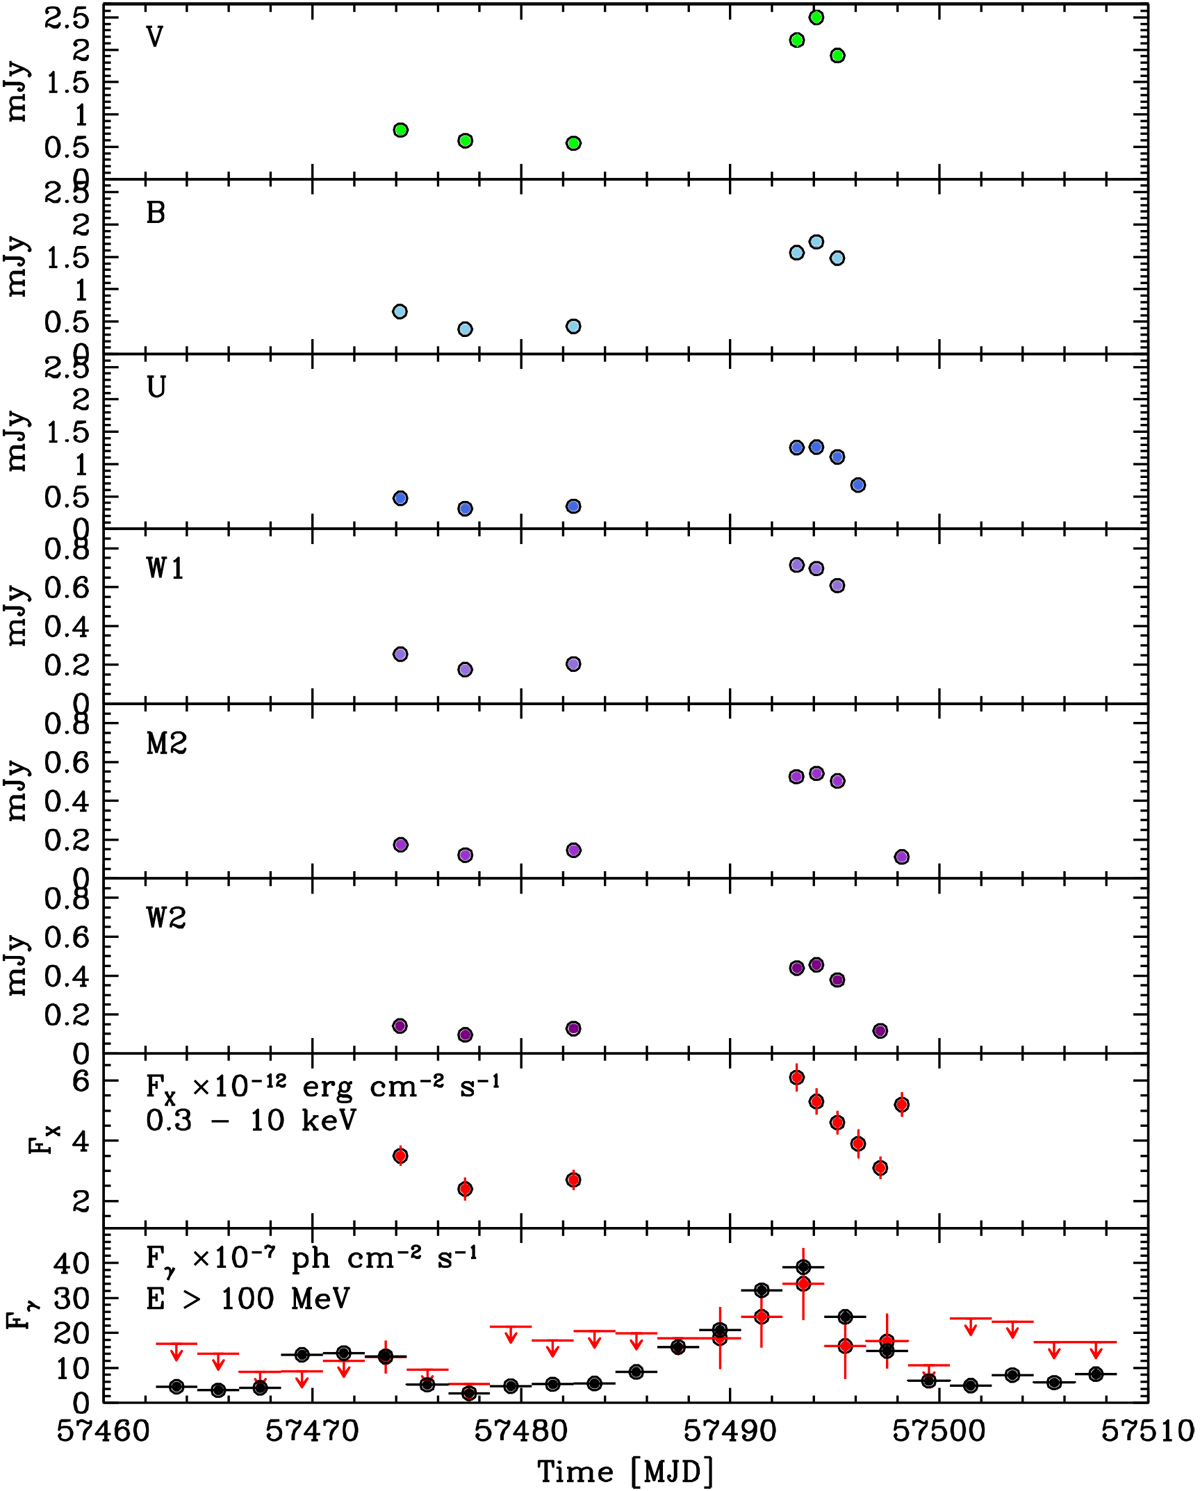
From top to bottom: panels 1–6: UVOT data (w1, m2, w2, u, b, v bands observed flux in units of mJy) acquired during the observations described in Table 1; panel 7: Swift/XRT (0.3−10.0 keV observed flux in units of 10−12 erg cm−2 s−1); last panel: γ-ray 48 h-bin light curve (>100 MeV observed flux in units of 10−7 photons cm−2 s−1), AGILE datain red, Fermi-LAT in black. The only NIR data from OAGH available during this time interval were taken on MJD ~ 57498 (flux density = (2.64 ± 0.10) mJy in J band, (4.16 ± 0.19) mJy in H band, (5.91 ± 0.27) mJy in Ks band).
Current usage metrics show cumulative count of Article Views (full-text article views including HTML views, PDF and ePub downloads, according to the available data) and Abstracts Views on Vision4Press platform.
Data correspond to usage on the plateform after 2015. The current usage metrics is available 48-96 hours after online publication and is updated daily on week days.
Initial download of the metrics may take a while.