Fig. 3
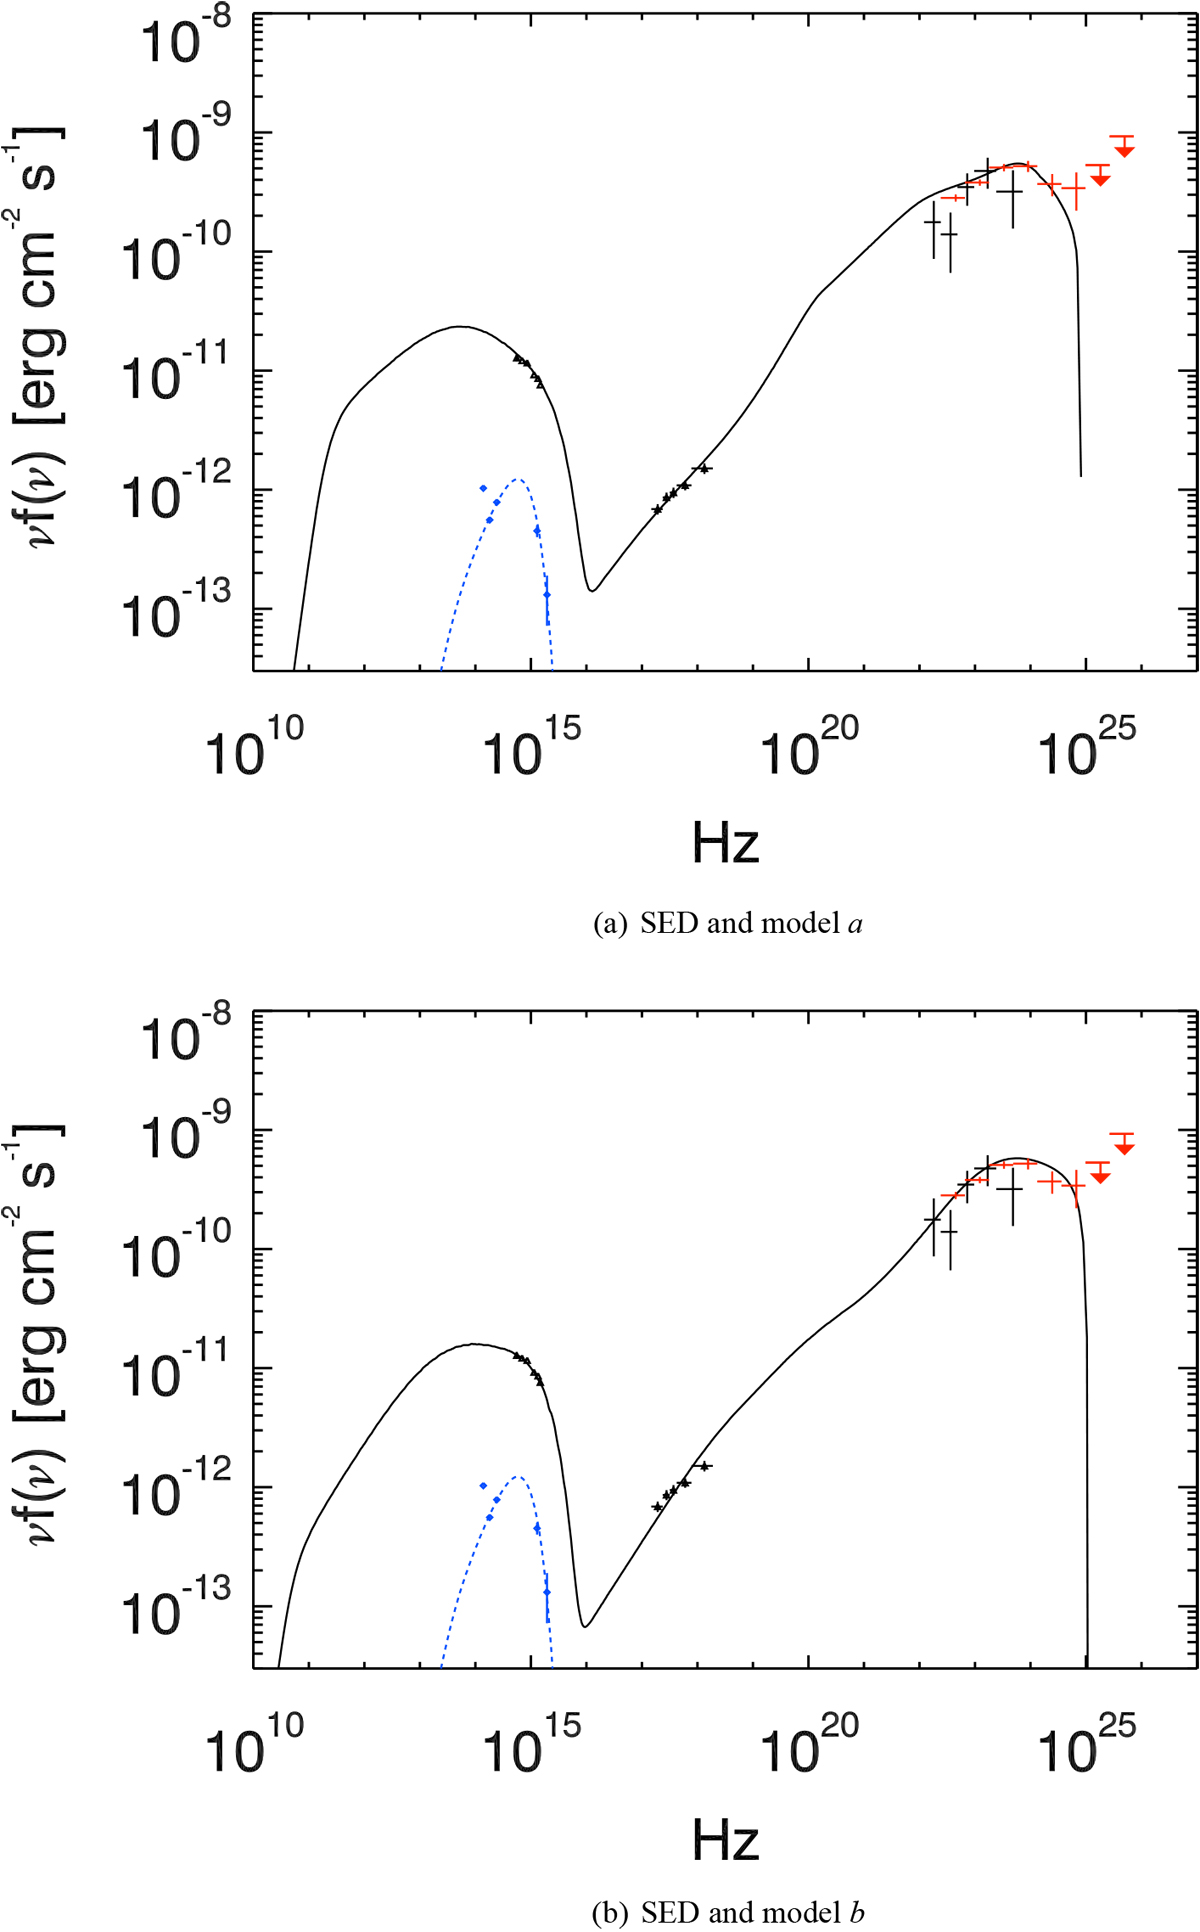
Spectral energy distribution for the brightest flare in April 2016 of PKS 2023-07. AGILE (black points) and Fermi-LAT (red point) data from 2016 April 10 UT 12:00:00 to 2016 April 20 UT 12:00:00 (MJD: 57488.50–57498.50), and Swift-UVOT and Swift-XRT data from 2016 April 15 UT 03:32:56 and 2016 April 20 UT 06:22:55 (MJD: 57493.15–57498.27). The low activity period observed in NIR on MJD ~ 57688 is reported in gray together with archival GALEX data, and with the Shakura–Sunyaev accretion disk model. Top (bottom) panel: SED model a (SED model b) for the flaring period is shown.
Current usage metrics show cumulative count of Article Views (full-text article views including HTML views, PDF and ePub downloads, according to the available data) and Abstracts Views on Vision4Press platform.
Data correspond to usage on the plateform after 2015. The current usage metrics is available 48-96 hours after online publication and is updated daily on week days.
Initial download of the metrics may take a while.