Fig. 3.
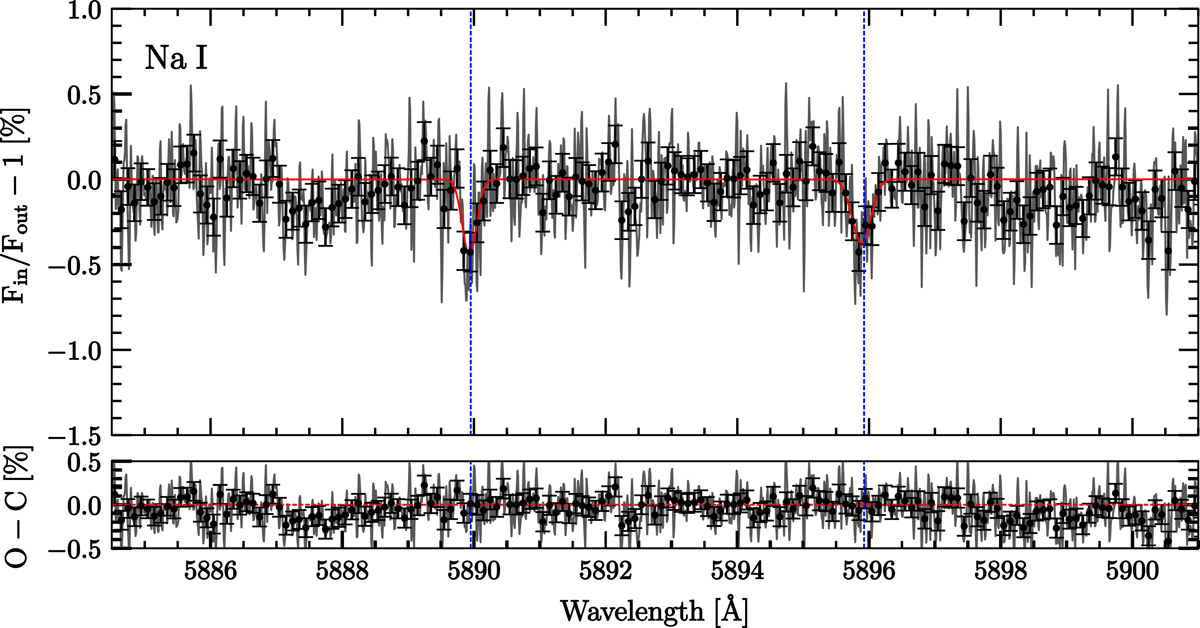
Transmission spectrum of MASCARA-2b atmosphere in the region of Na I D doublet. In the top panel the atmospheric transmission spectrum is presented in light gray. Black dots indicate the binned transmission spectrum by 10 pixels and the Gaussian fit to each Na I D lines is shown in red; its residuals are shown in the bottom panel. The expected wavelength position of the Na I doublet lines, in the planetary reference frame, are indicated with blue vertical lines. The uncertainties of the relative flux come from the error propagation of the photon and readout noise from the original data.
Current usage metrics show cumulative count of Article Views (full-text article views including HTML views, PDF and ePub downloads, according to the available data) and Abstracts Views on Vision4Press platform.
Data correspond to usage on the plateform after 2015. The current usage metrics is available 48-96 hours after online publication and is updated daily on week days.
Initial download of the metrics may take a while.