Fig. 4.
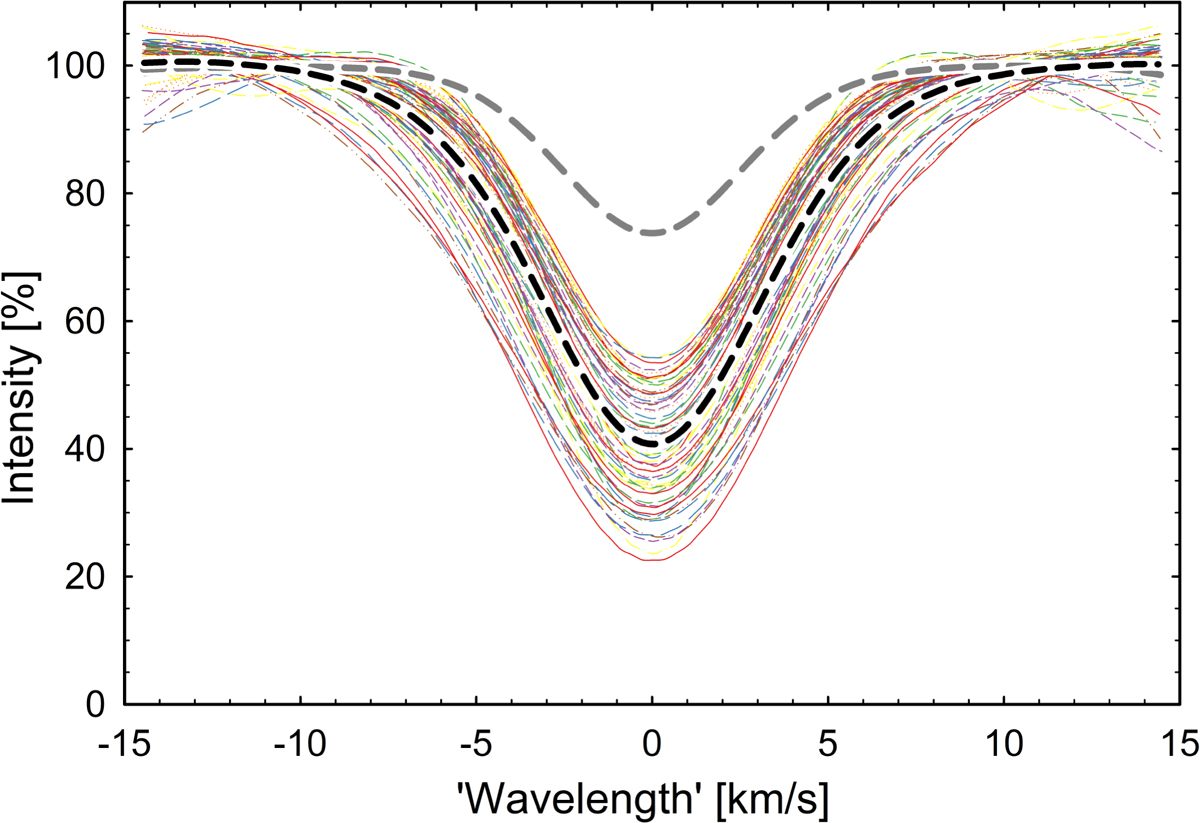
Forming averages from groups of similar lines. Individual profiles of the 72 selected strong Fe I lines (observed central intensities below 55% of the continuum) are shown (colored), together with their average (dashed black), forming a representative strong line profile. An analogous subset of 86 weak Fe I lines (central intensities shallower than 55%) produces a representative weak line profile (dashed gray).
Current usage metrics show cumulative count of Article Views (full-text article views including HTML views, PDF and ePub downloads, according to the available data) and Abstracts Views on Vision4Press platform.
Data correspond to usage on the plateform after 2015. The current usage metrics is available 48-96 hours after online publication and is updated daily on week days.
Initial download of the metrics may take a while.