Fig. 9
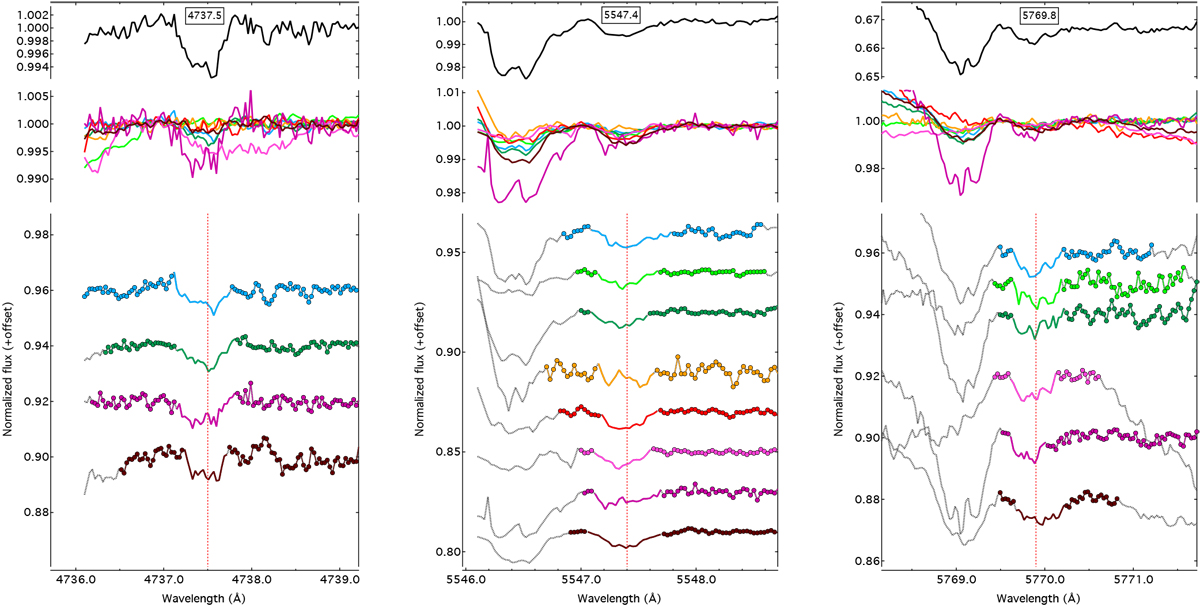
Potential new detection of weak C2-DIBs at 4737.5, 5547.4, and 5769.8 Å (they appear toward sigthlines where the other C2 -DIBs are well-detected). The red dashed line shows the DIB location. Top graphs (black) in all three panels: extracted average normalized profile of C2-DIBs created from stacking three single-cloud targets: HD 23180, HD 203532, and HD 147889, shown below. Middle in all three panels: overlaid C2 -DIB profiles at the same vertical scale for all stars. Bottom in all three panels: same C2 -DIB vertically displaced and depth-equalized profiles. The red dashed line shows the DIB location. The wavelengths are in the interstellar rest frame. See Fig. 1 for color coding.
Current usage metrics show cumulative count of Article Views (full-text article views including HTML views, PDF and ePub downloads, according to the available data) and Abstracts Views on Vision4Press platform.
Data correspond to usage on the plateform after 2015. The current usage metrics is available 48-96 hours after online publication and is updated daily on week days.
Initial download of the metrics may take a while.