Free Access
Fig. 3.
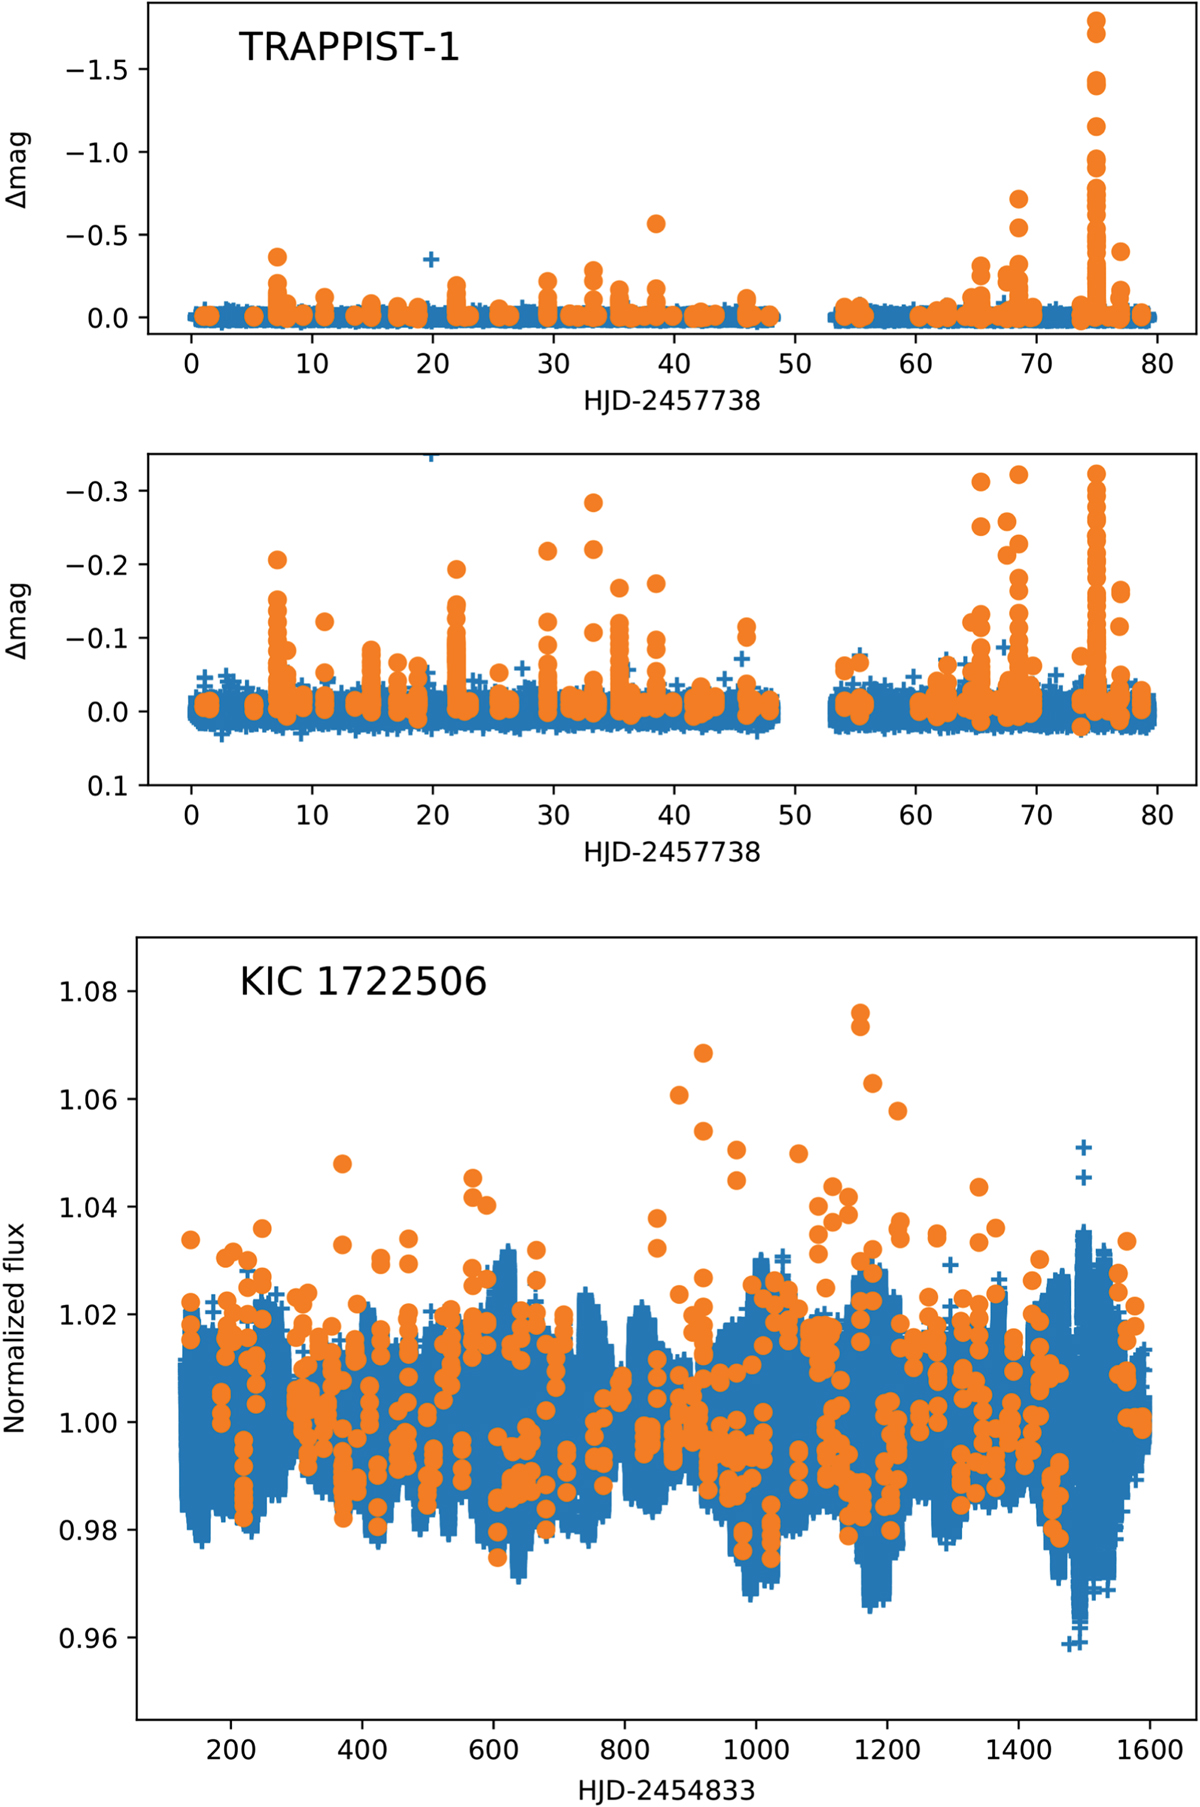
Top: selected flare candidates in the TRAPPIST-1 short-cadence K2 data. The upper panel shows the total light curve, the middle plot is zoomed-in to show smaller events. Bottom: similar analysis, but for long-cadence Kepler data of KIC 1722506.
Current usage metrics show cumulative count of Article Views (full-text article views including HTML views, PDF and ePub downloads, according to the available data) and Abstracts Views on Vision4Press platform.
Data correspond to usage on the plateform after 2015. The current usage metrics is available 48-96 hours after online publication and is updated daily on week days.
Initial download of the metrics may take a while.