Fig. 11.
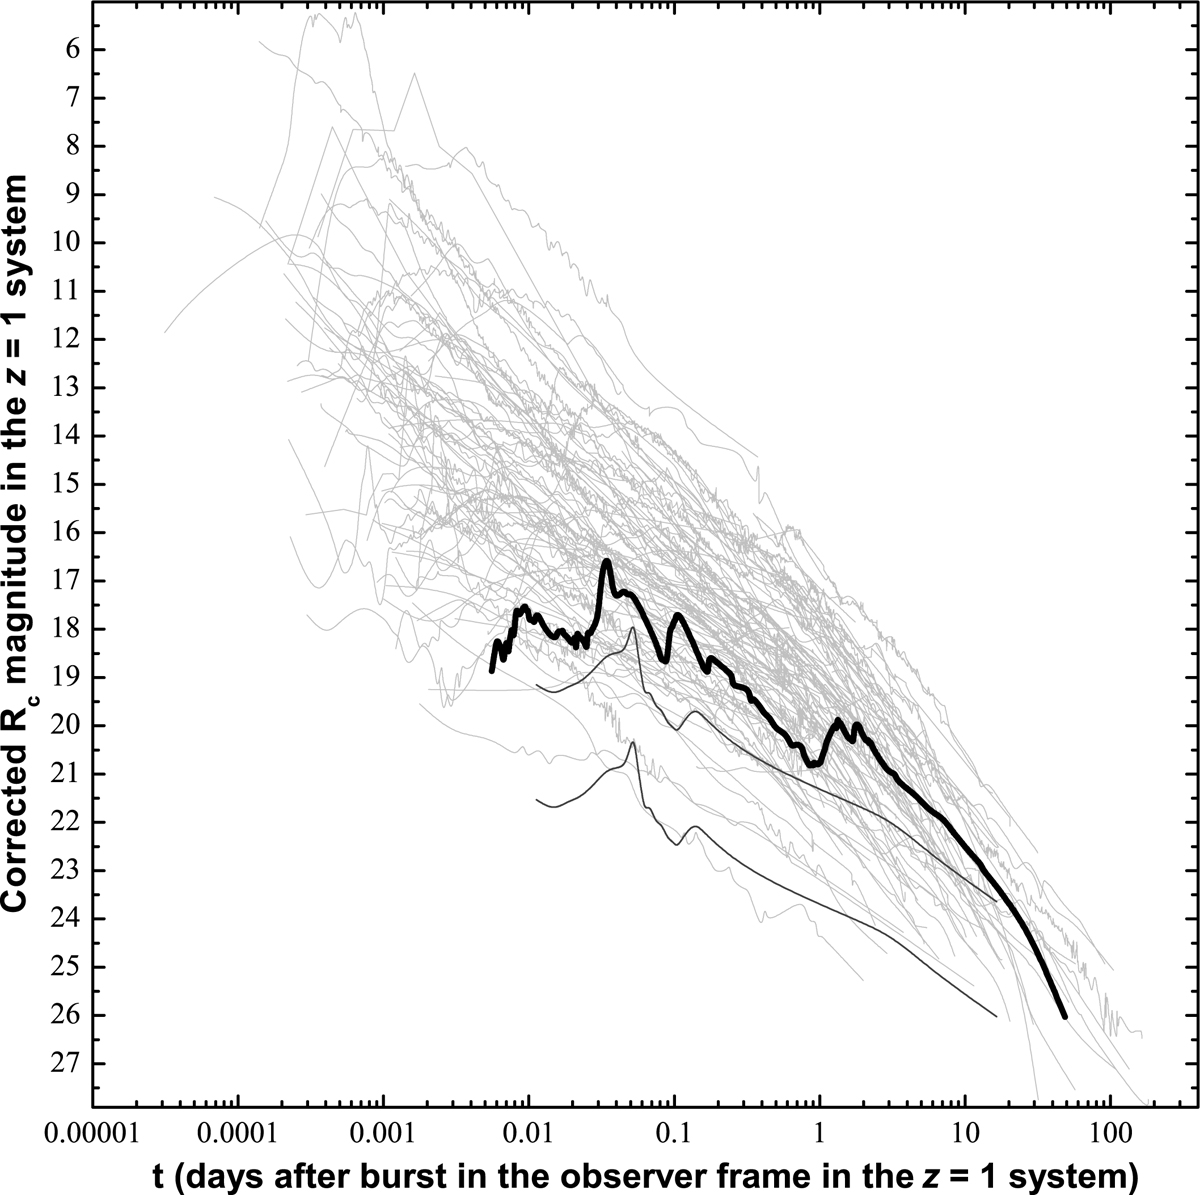
As Fig. 10, but now in the z = 1 system, where all light curves are directly comparable, having been corrected for all line-of-sight extinction and shifted to the same frame both in magnitude and time. The light curve of the afterglow of GRB 111209A is now seen to lie in the middle of the distribution of known afterglows, actually being among the least luminous at early times, and otherwise unremarkable from a luminosity standpoint. The afterglow of GRB 130925A is even fainter (the two different curves are based on two different extinction corrections; see text), and shows a remarkably similar evolution at early times.
Current usage metrics show cumulative count of Article Views (full-text article views including HTML views, PDF and ePub downloads, according to the available data) and Abstracts Views on Vision4Press platform.
Data correspond to usage on the plateform after 2015. The current usage metrics is available 48-96 hours after online publication and is updated daily on week days.
Initial download of the metrics may take a while.