Fig. 1
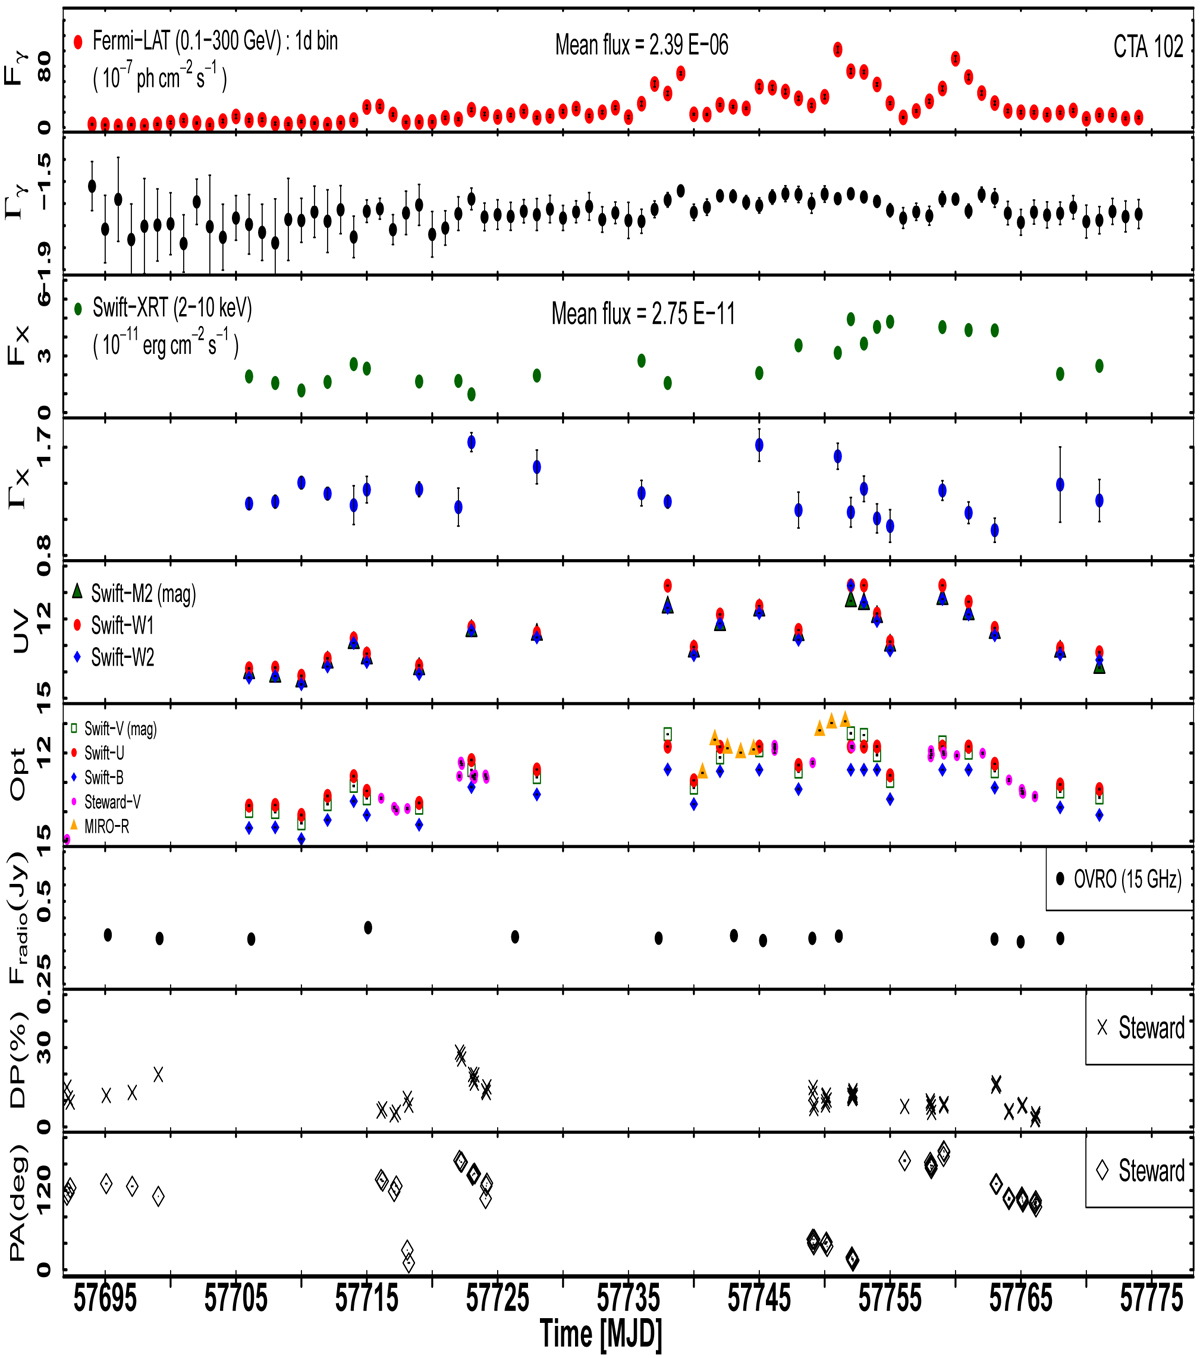
Multiwavelength light curves for CTA 102 during the 2016 November–2017 January outburst. From top panel to bottom panel: 1d binned Fermi-LAT γ-ray flux (E > 100 MeV) followed by γ-ray photon index; X-ray (2.0–10.0 keV) flux (Swift-XRT); X-ray photon index (γ; Swift-XRT); UV-band (W1, M2, W2) magnitudes (Swift-UVOT); Swift-UVOT, MIRO and Steward Observatory optical magnitudes; 15 GHz OVRO flux; Degree of Polarization (DP%) and position angle, PA, in degrees (Steward Observatory).
Current usage metrics show cumulative count of Article Views (full-text article views including HTML views, PDF and ePub downloads, according to the available data) and Abstracts Views on Vision4Press platform.
Data correspond to usage on the plateform after 2015. The current usage metrics is available 48-96 hours after online publication and is updated daily on week days.
Initial download of the metrics may take a while.