Free Access
Fig. 2
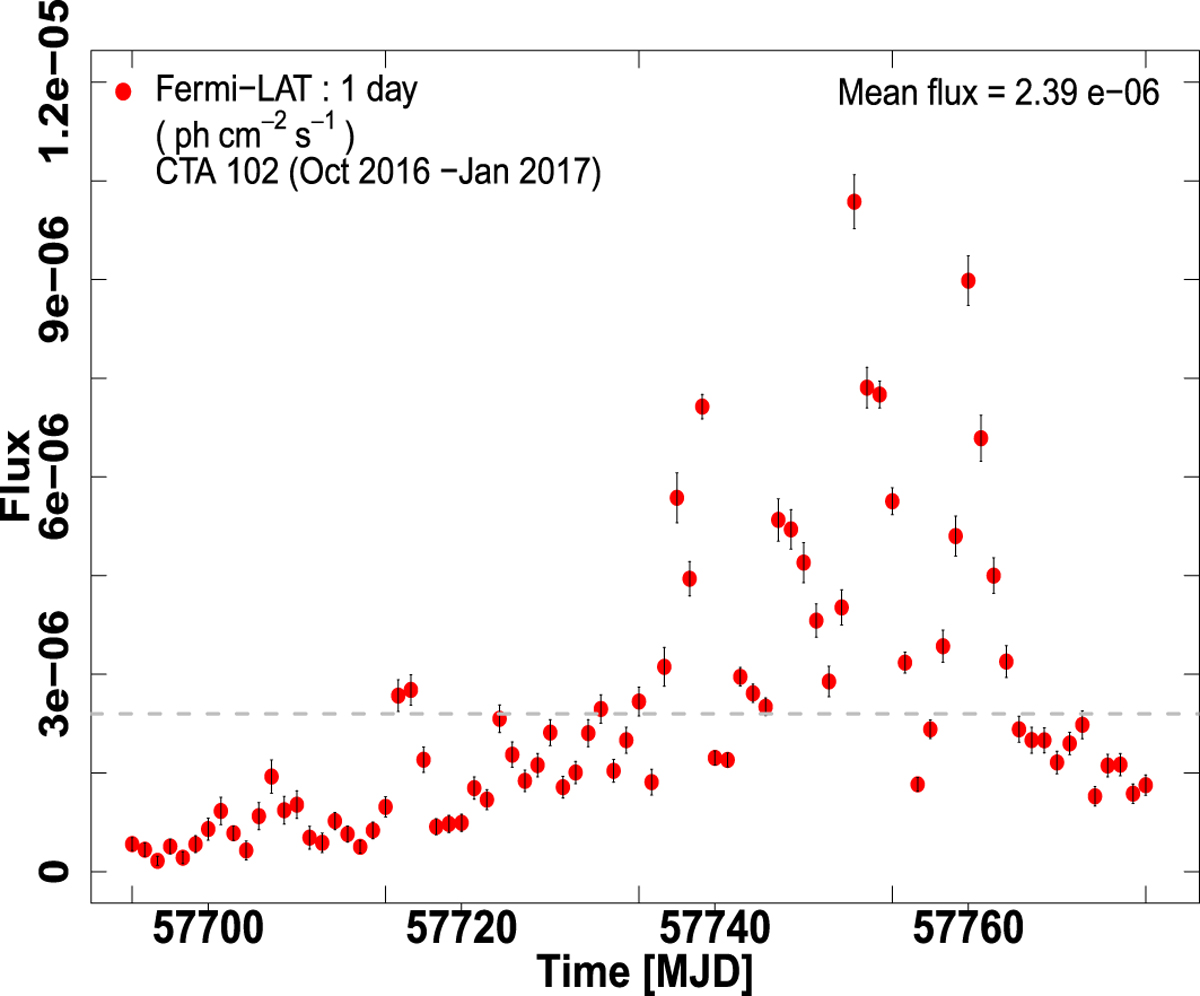
γ-ray light curve of FSRQ CTA 102 showing flaring activity during November 2016–January 2017. Time in MJD is plotted along X-axis and flux along Y-axis. The gray dashed line shows the average flux level.
Current usage metrics show cumulative count of Article Views (full-text article views including HTML views, PDF and ePub downloads, according to the available data) and Abstracts Views on Vision4Press platform.
Data correspond to usage on the plateform after 2015. The current usage metrics is available 48-96 hours after online publication and is updated daily on week days.
Initial download of the metrics may take a while.