Fig. 11.
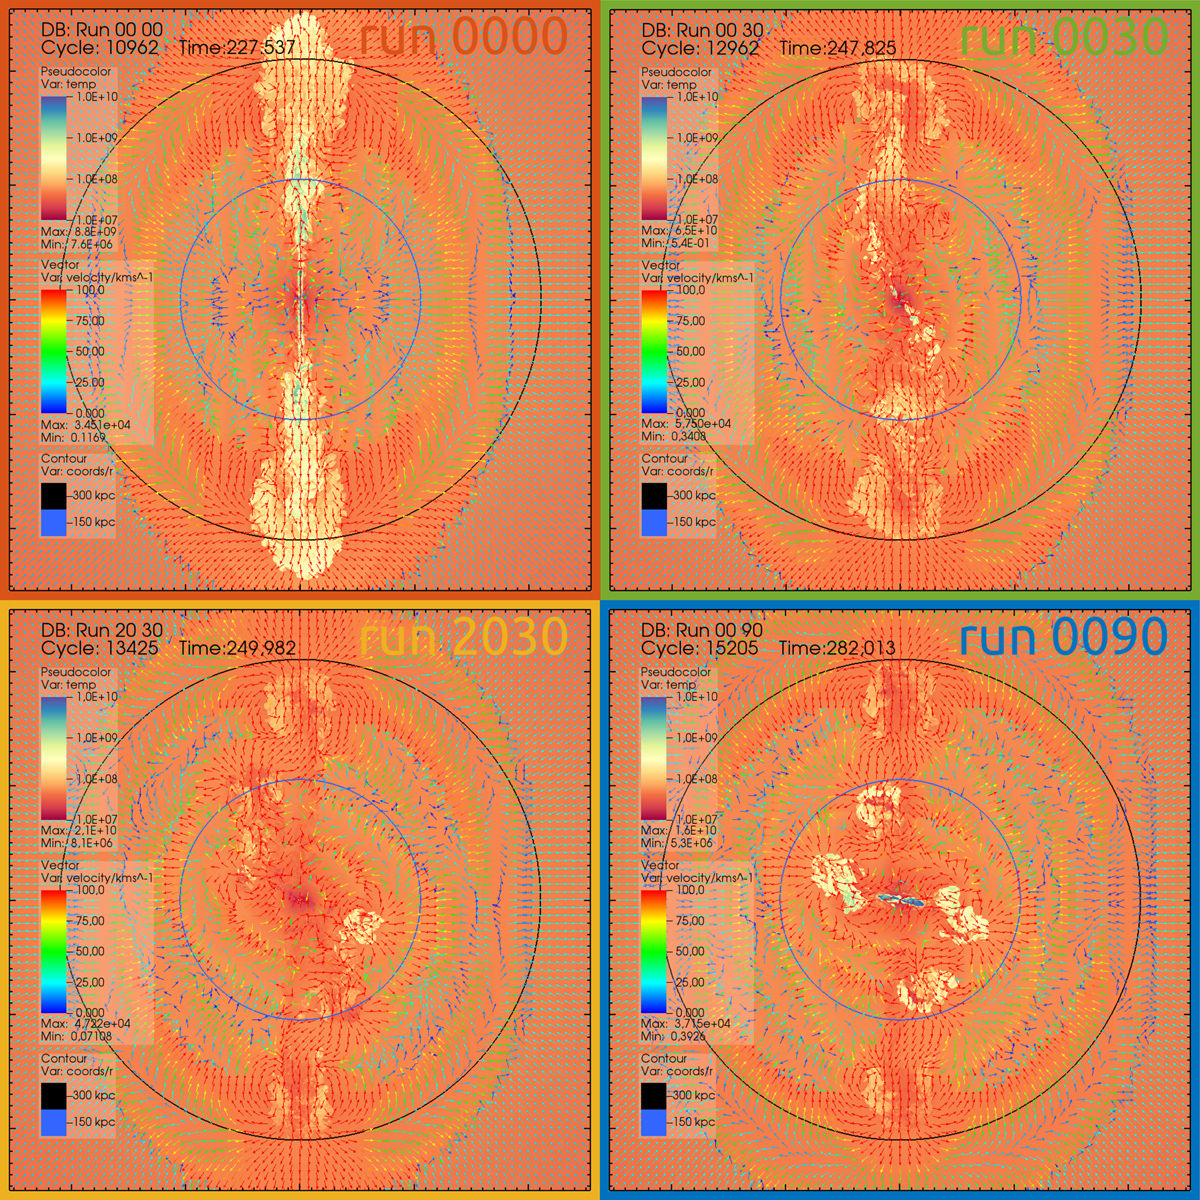
Temperature slices along the y = 0 plane, showing the final snapshots of all simulations. The superimposed arrows trace the velocity field (capped at 100 km s−1) and spherical contours mark 150 and 300 kpc. Fast outflows counteract a slow but steady cooling flow. A complex inflow/outflow pattern develops as bow-shocks propagate in the ICM. However, significant outflows within 150 kpc are seen almost exclusively in run 2030 and 0090. Hot, sparse and very extended backflows wrap around all cavities. We note that a knot of cooler gas is present at the cluster centre in all runs.
Current usage metrics show cumulative count of Article Views (full-text article views including HTML views, PDF and ePub downloads, according to the available data) and Abstracts Views on Vision4Press platform.
Data correspond to usage on the plateform after 2015. The current usage metrics is available 48-96 hours after online publication and is updated daily on week days.
Initial download of the metrics may take a while.