Open Access
Fig. 12.
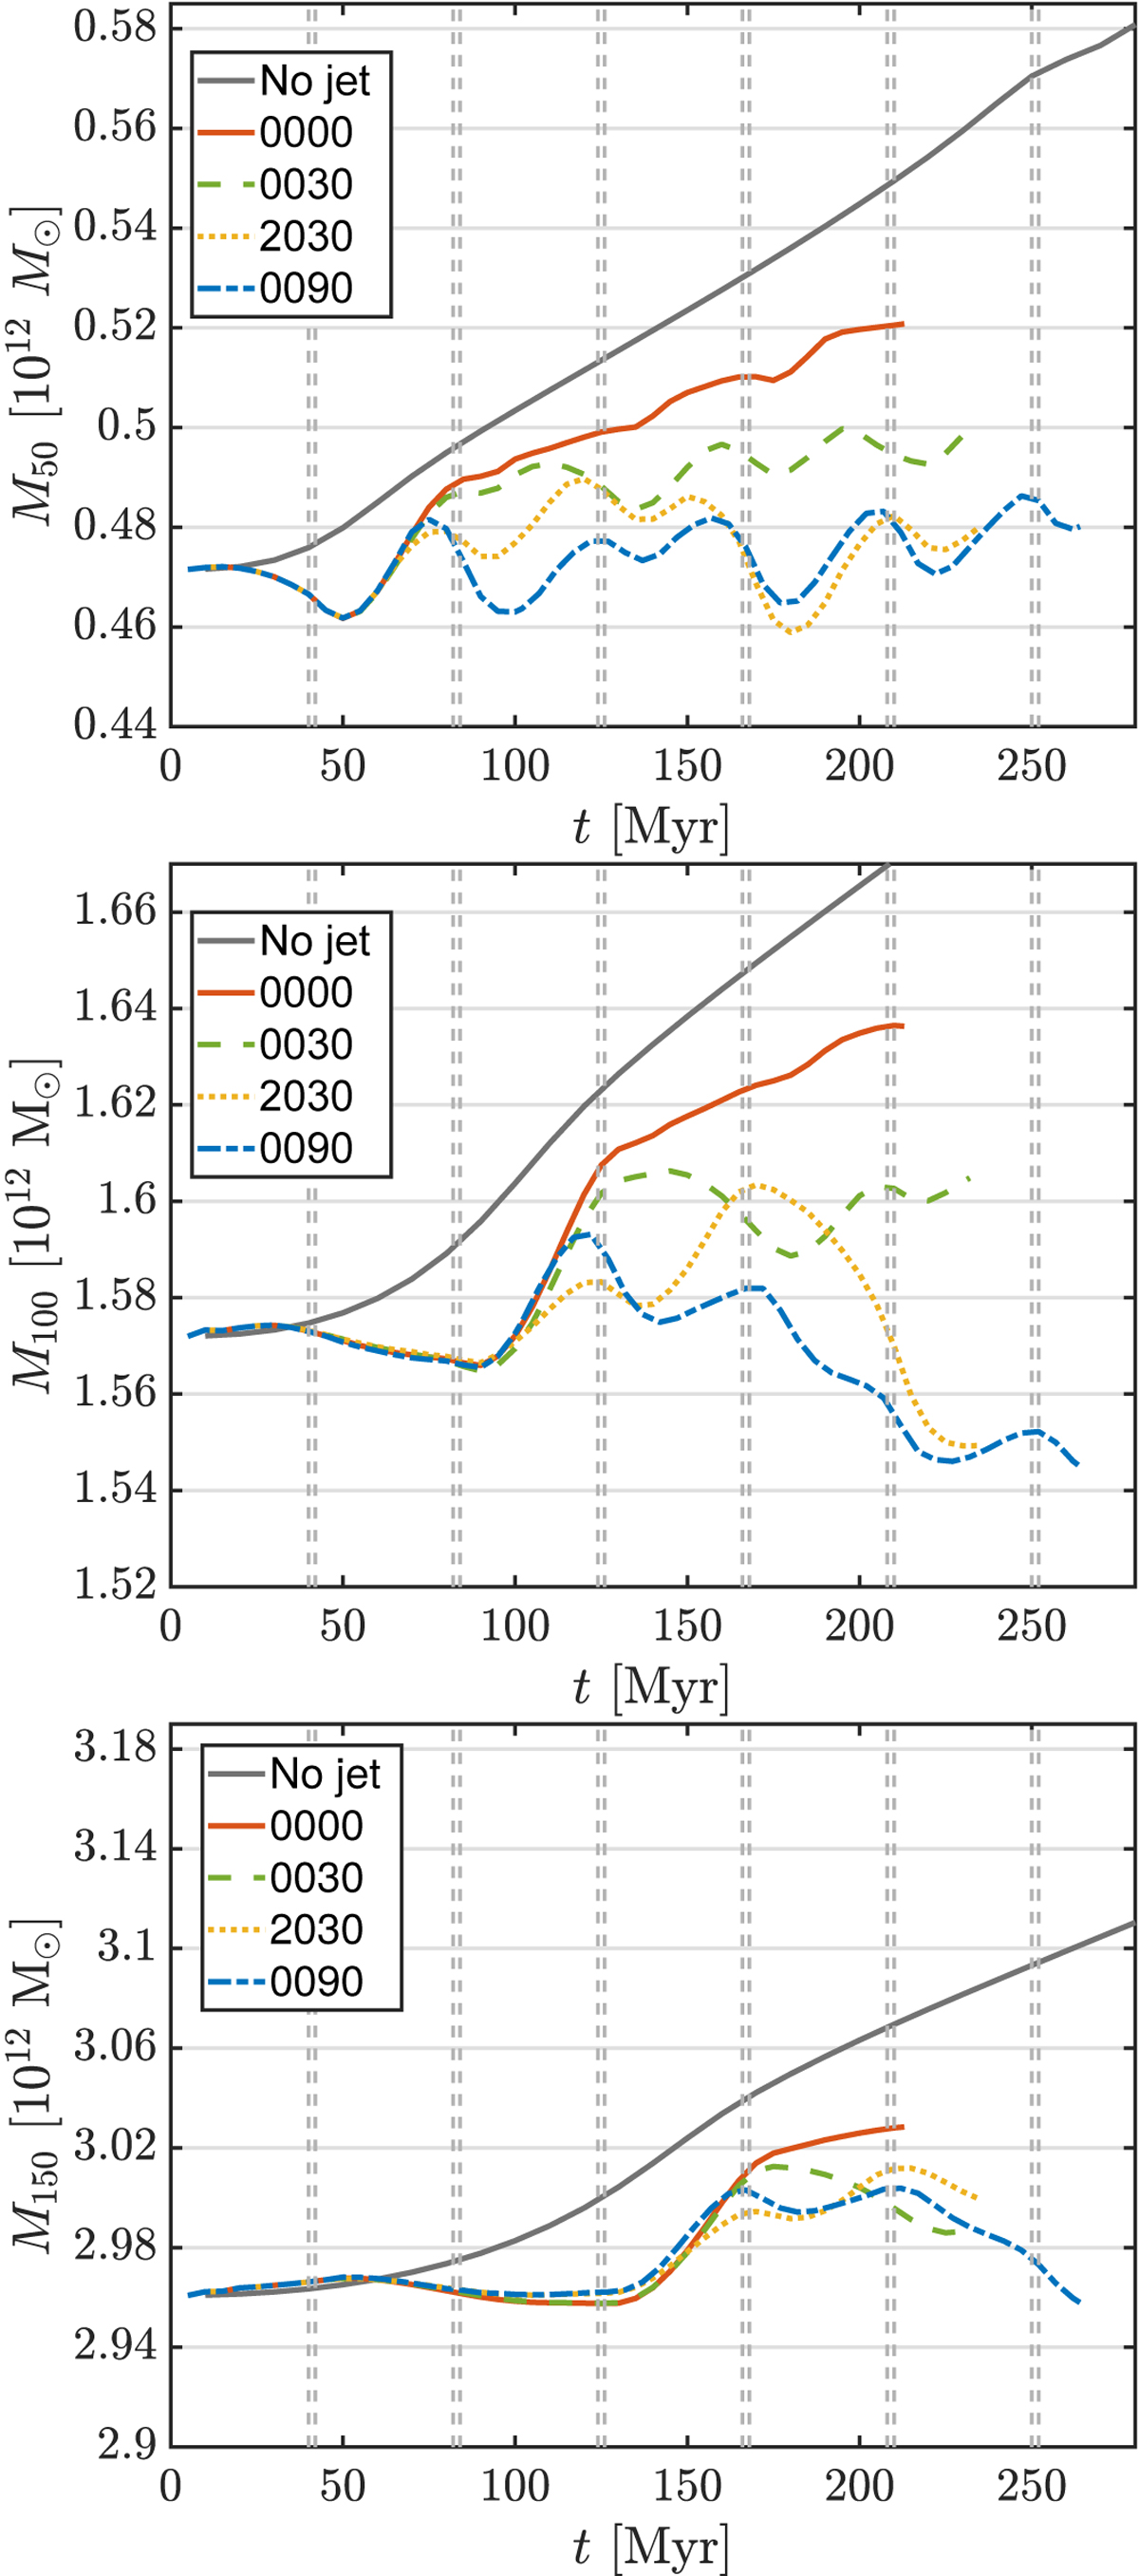
Evolution of the gas mass M within the central 50, 100, and 150 kpc spherical regions, from top to bottom). Grey line: pure cooling flow case. Coloured lines: jetted runs, as indicated by the key. Without feedback, M50 increases by more than 20%. For a discussion of the trends exhibited by the jetted runs, see the text.
Current usage metrics show cumulative count of Article Views (full-text article views including HTML views, PDF and ePub downloads, according to the available data) and Abstracts Views on Vision4Press platform.
Data correspond to usage on the plateform after 2015. The current usage metrics is available 48-96 hours after online publication and is updated daily on week days.
Initial download of the metrics may take a while.