Fig. 5.
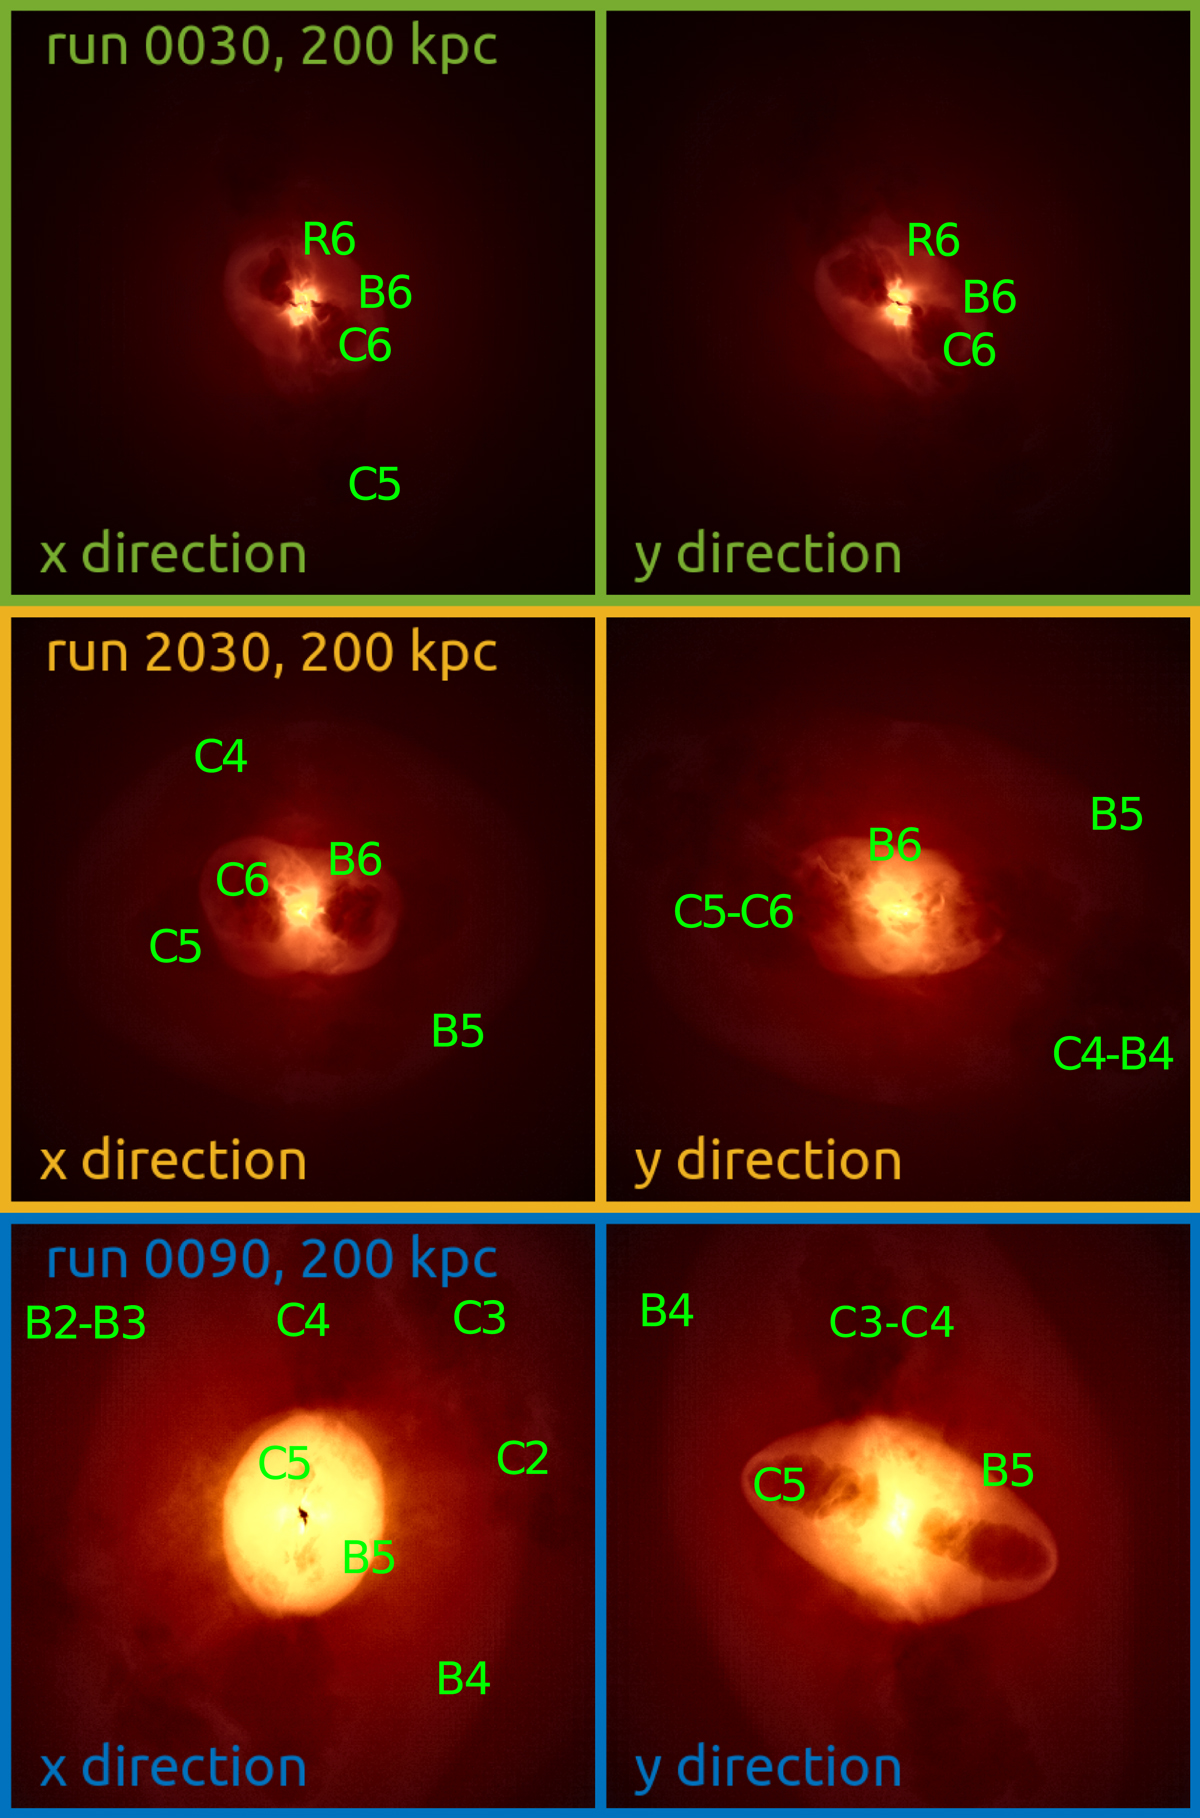
Synthetic X-ray observations, similar to the ones appearing in Figs. 2 (run 0030) to 4 (run 0090), but zooming into the innermost 200 kpc and simulating the ACIS-I detector. Projections are along the x (left column) and y axes (right column). The labels match the ones in Figs. 2–4, for direct comparison. We note the increased details at the cavity boundary and how the different perspective changes the apparent volume of the cavities.
Current usage metrics show cumulative count of Article Views (full-text article views including HTML views, PDF and ePub downloads, according to the available data) and Abstracts Views on Vision4Press platform.
Data correspond to usage on the plateform after 2015. The current usage metrics is available 48-96 hours after online publication and is updated daily on week days.
Initial download of the metrics may take a while.