Fig. 9.
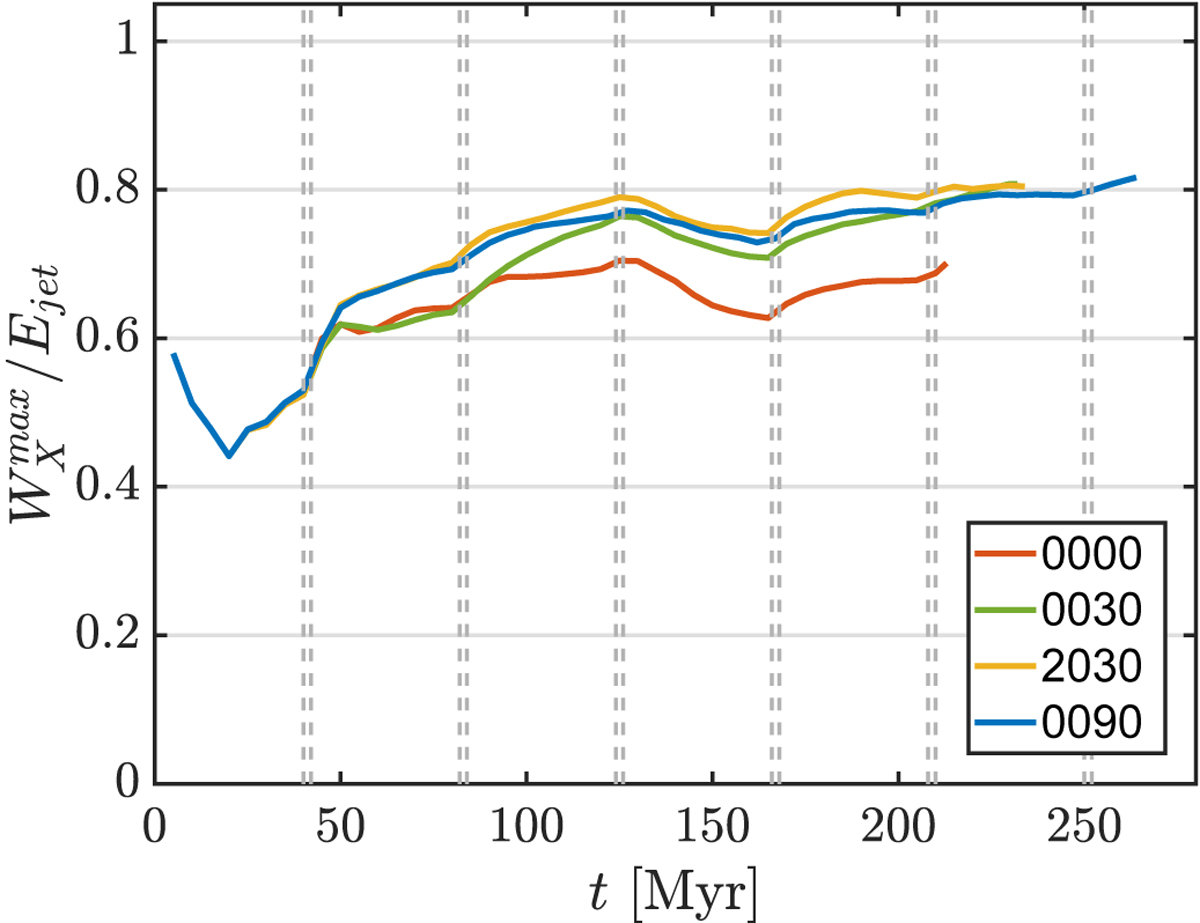
Time evolution of Wmax, upper limit on the global amount of energy available to heat the ICM, in units of the jet input energy Ejet (Eq. (7)). The vertical dash-dot grey lines represent the beginning and end of each jet event. Most re-orienting jets converge to a value of about 80% towards the end of the simulation; they all release more energy than the 0000 case, which does not exceed ~65%.
Current usage metrics show cumulative count of Article Views (full-text article views including HTML views, PDF and ePub downloads, according to the available data) and Abstracts Views on Vision4Press platform.
Data correspond to usage on the plateform after 2015. The current usage metrics is available 48-96 hours after online publication and is updated daily on week days.
Initial download of the metrics may take a while.