Free Access
Fig. B.1.
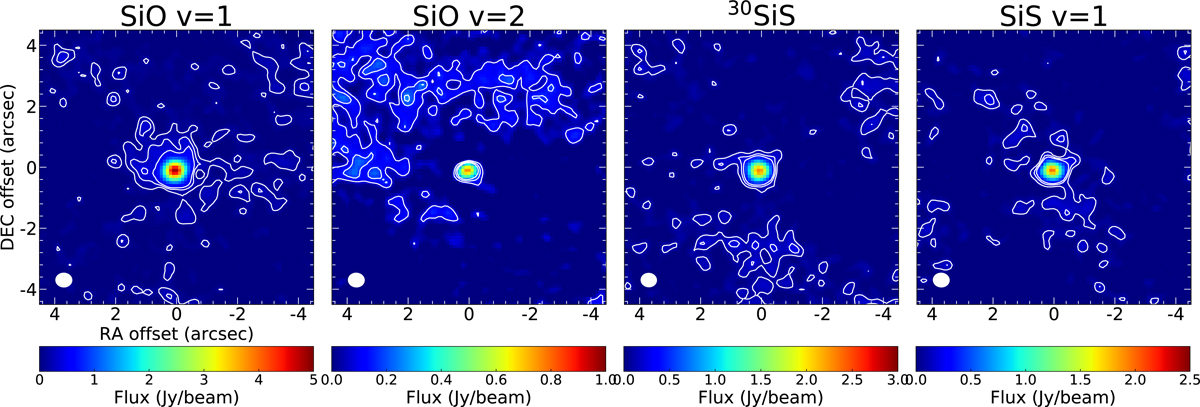
ALMA integrated intensity (moment 0) maps of SiO v = 1 (8–7), SiO v = 2 (8–7), 30SiS (19–18) and SiS v = 1 (19–18) emission around W Aql. The ALMA beam is given in the lower-left corner. Contours are given in white for 1, 2, and 3 σ rms. North is up and east is left.
Current usage metrics show cumulative count of Article Views (full-text article views including HTML views, PDF and ePub downloads, according to the available data) and Abstracts Views on Vision4Press platform.
Data correspond to usage on the plateform after 2015. The current usage metrics is available 48-96 hours after online publication and is updated daily on week days.
Initial download of the metrics may take a while.