Fig. C.2.
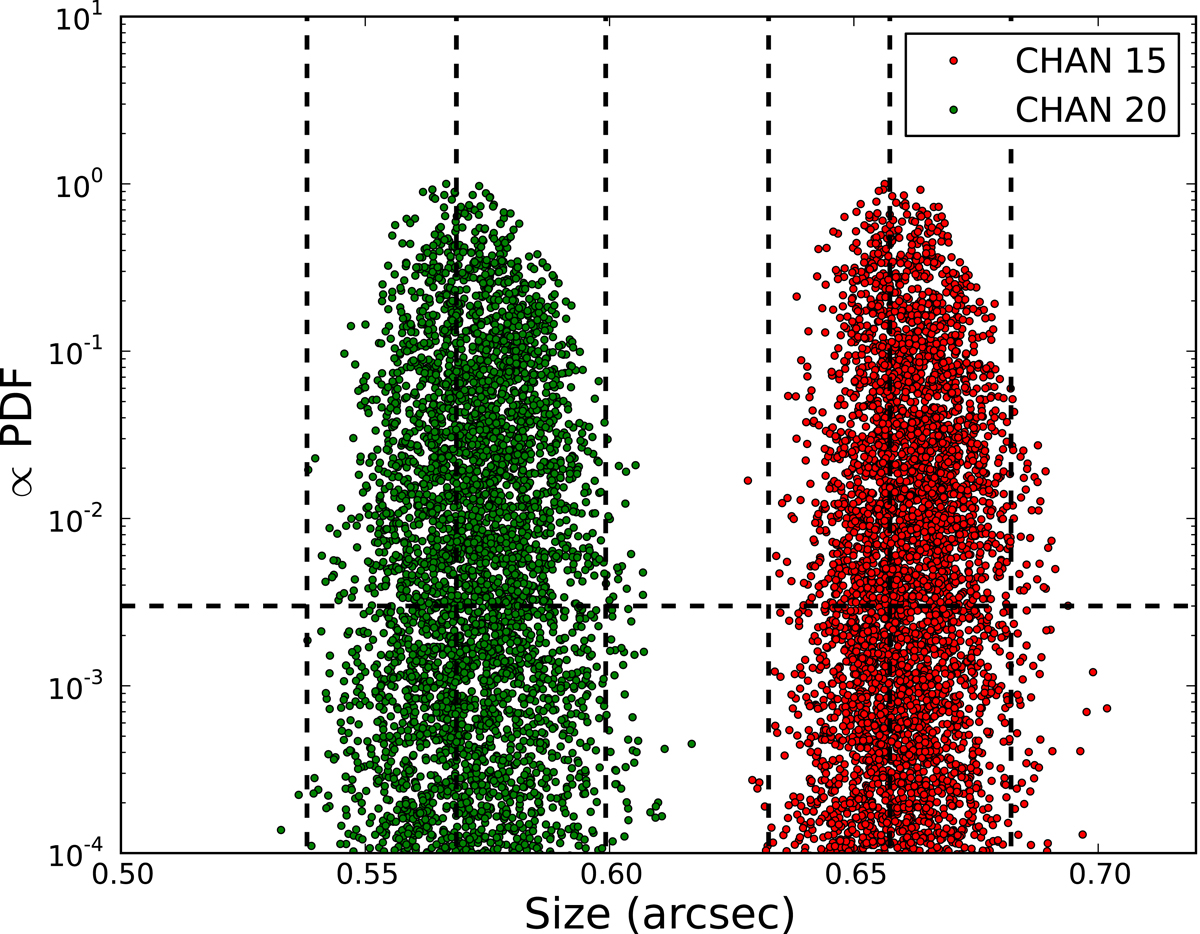
Probability density distributions from our model-fitting for the SiS line of channels 15 and 20, using a Gaussian source model with addition of a delta function model. The vertical dashed lines indicate the estimated best-fit values and their ±3σ deviations. The horizontal dashed line is set to 3 × 10⁻³ (i.e., the probability density corresponding to the 3σ cutoff of a Gaussian probability distribution). The peaks of the PDFs have been further scaled to 1, for clarity.
Current usage metrics show cumulative count of Article Views (full-text article views including HTML views, PDF and ePub downloads, according to the available data) and Abstracts Views on Vision4Press platform.
Data correspond to usage on the plateform after 2015. The current usage metrics is available 48-96 hours after online publication and is updated daily on week days.
Initial download of the metrics may take a while.