Fig. 6.
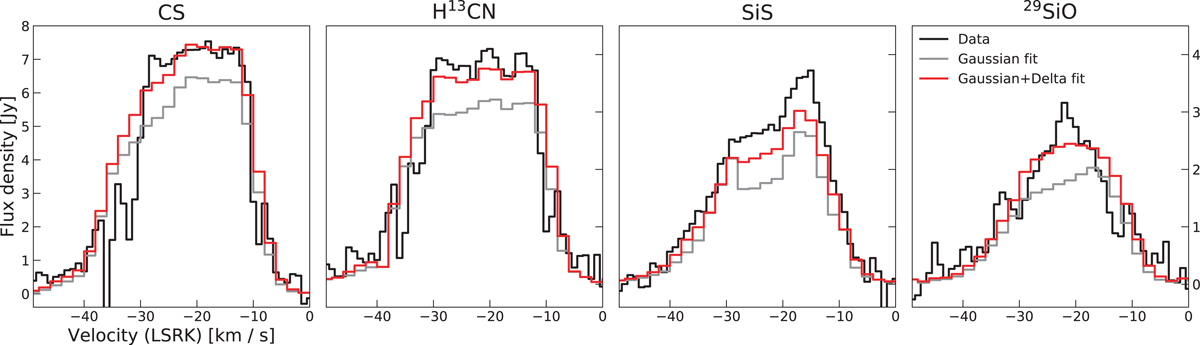
Comparison of the observed spectra (black) with the uv-fitted spectra of the Gaussian fit (gray) and the fit including a Gaussian plus a delta function (red). The observed spectra were extracted from the images with an aperture of 5″ diameter. The effective beam size in the observed images is 0.55″ × 0.48″. We note that the y-axis scales differently for the first spectral line, which is the strongest. The respective scales are given on the left-hand side for the first line, and on the right-hand side for the remaining lines.
Current usage metrics show cumulative count of Article Views (full-text article views including HTML views, PDF and ePub downloads, according to the available data) and Abstracts Views on Vision4Press platform.
Data correspond to usage on the plateform after 2015. The current usage metrics is available 48-96 hours after online publication and is updated daily on week days.
Initial download of the metrics may take a while.