Fig. 1.
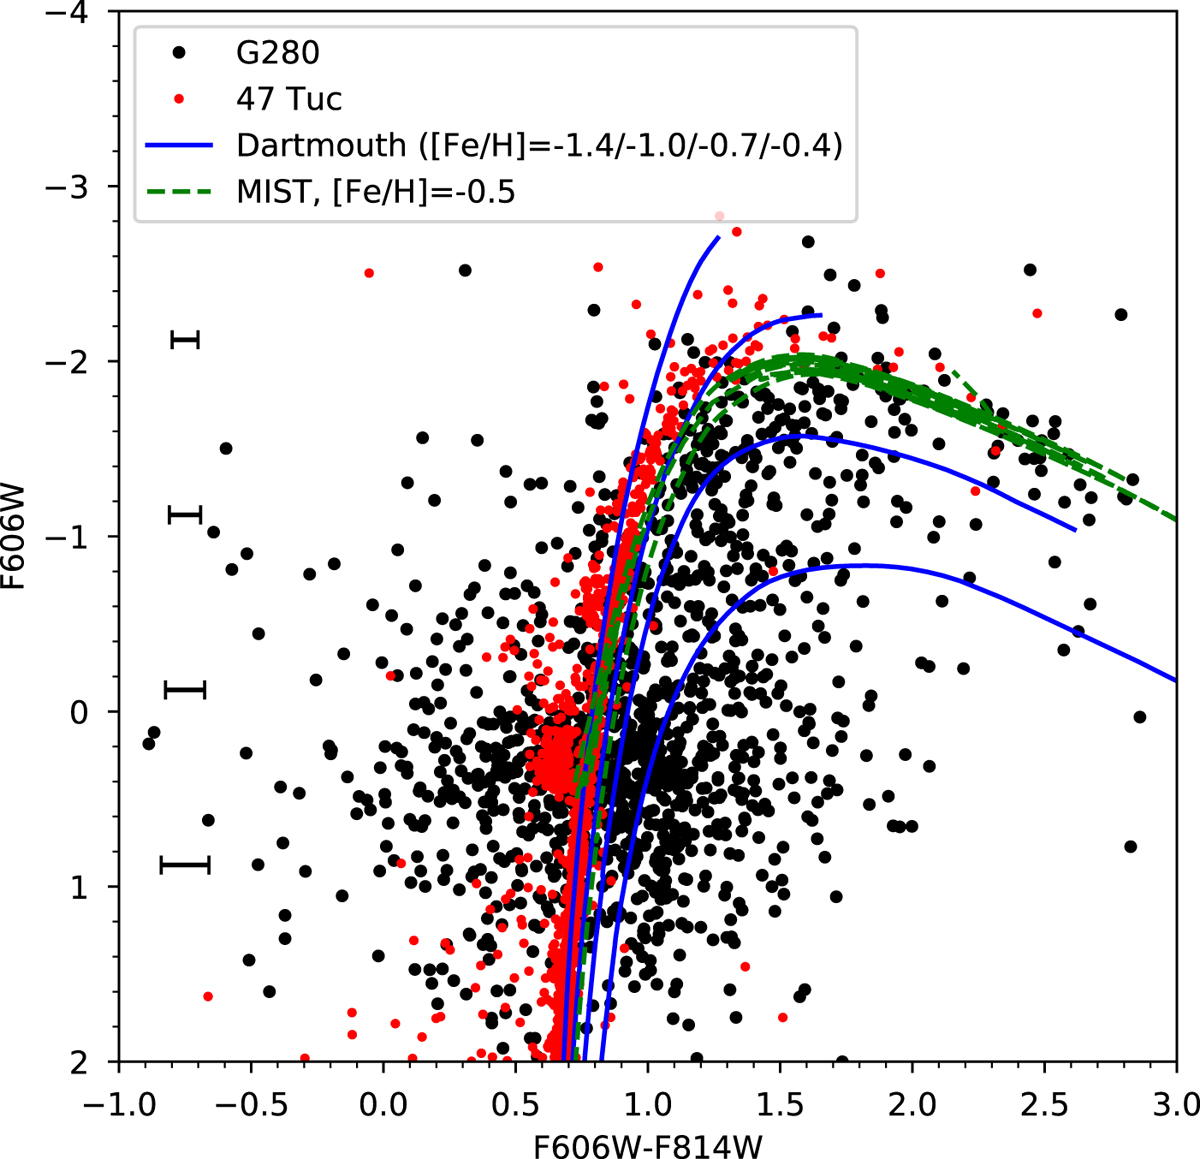
ACS/HRC colour-magnitude diagram for G280. The blue lines are Dartmouth isochrones with ages of 11 Gyr and [Fe/H] = −1.4, −1.0, −0.7, and −0.4 (Dotter et al. 2007), while the green line is a 10 Gyr MIST isochrone with [Fe/H] = −0.5 (Choi et al. 2016; Dotter 2016). Red dots are ACSGCS data for 47 Tuc (Sarajedini et al. 2007).
Current usage metrics show cumulative count of Article Views (full-text article views including HTML views, PDF and ePub downloads, according to the available data) and Abstracts Views on Vision4Press platform.
Data correspond to usage on the plateform after 2015. The current usage metrics is available 48-96 hours after online publication and is updated daily on week days.
Initial download of the metrics may take a while.