Fig. 11.
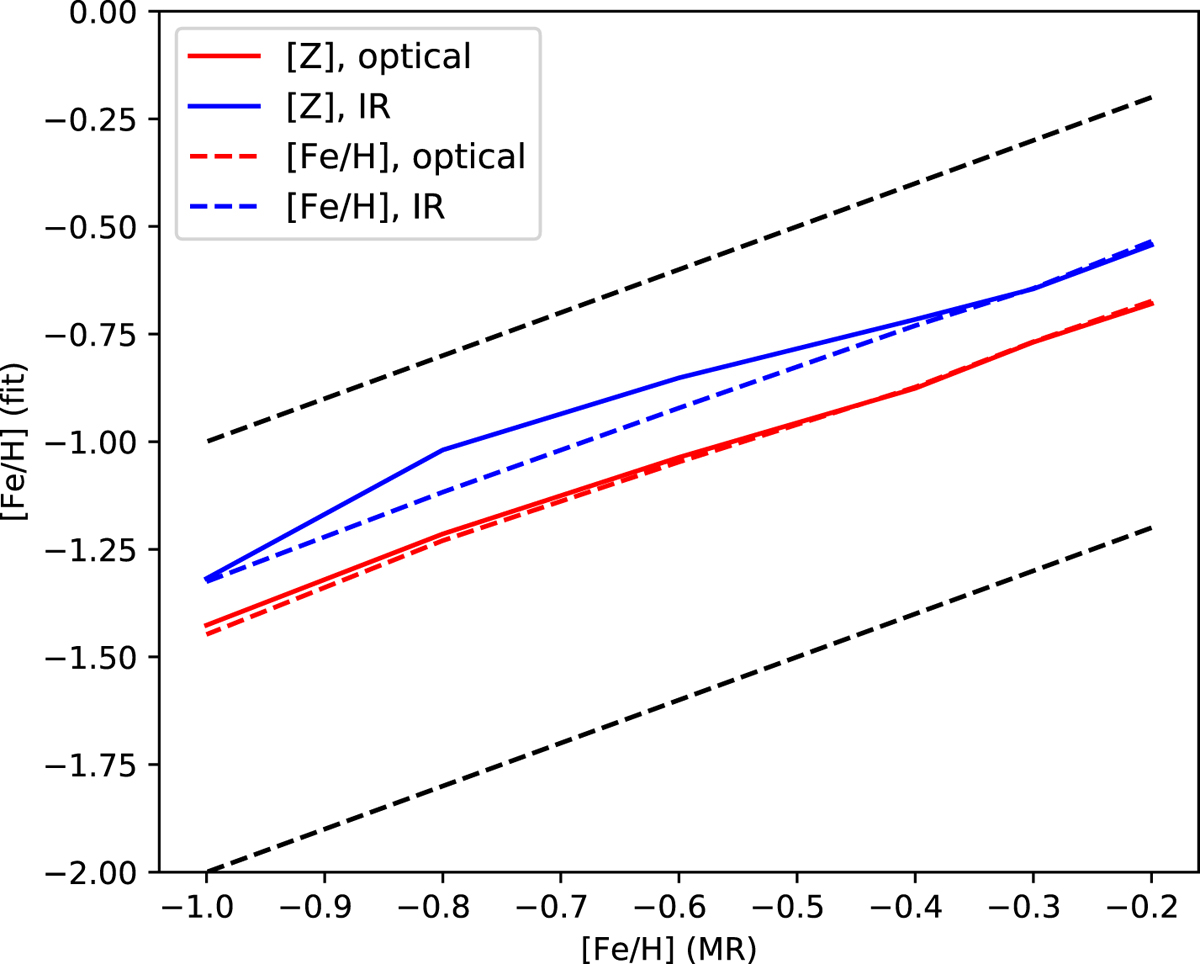
Metallicities derived from single-population fits to two-population models in the optical and infrared, plotted as a function of the input metallicity of the metal rich (MR) population. The solid coloured lines show fits where a global scaling was applied to all elements (labelled [Z]) whereas coloured dashed lines show fits where only Fe was varied (labelled [Fe/H]). The black dashed lines show the input metallicities.
Current usage metrics show cumulative count of Article Views (full-text article views including HTML views, PDF and ePub downloads, according to the available data) and Abstracts Views on Vision4Press platform.
Data correspond to usage on the plateform after 2015. The current usage metrics is available 48-96 hours after online publication and is updated daily on week days.
Initial download of the metrics may take a while.