Fig. 2
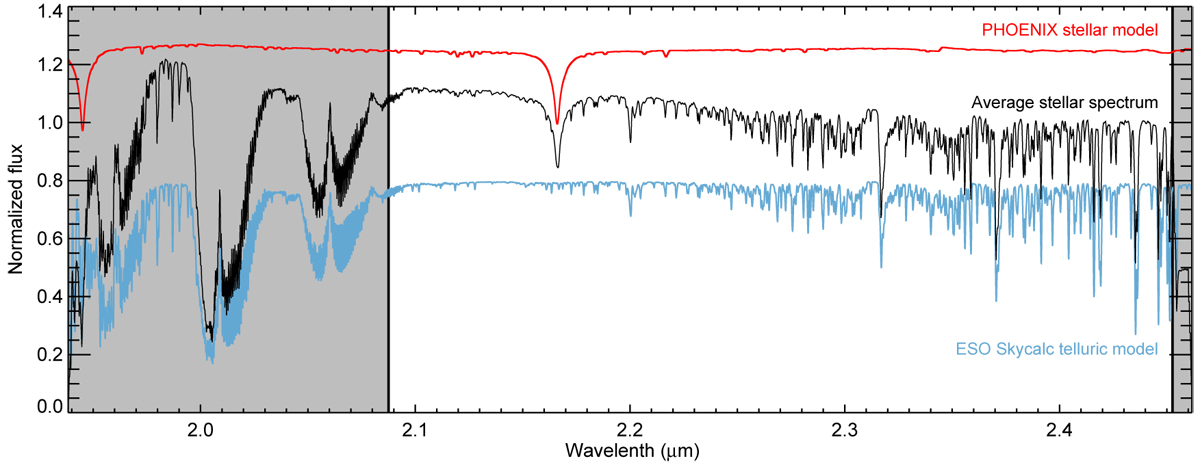
Average stellar spectrum of the master cube of the second night (black), compared to a continuum-normalized rotation-broadened PHOENIX model in red (Husser et al. 2013) and a telluric transmission spectrum as obtained using ESO SkyCalc in blue (Noll et al. 2012; Jones et al. 2013), both convolved to the spectral resolution of SINFONI. There are few stellar absorption lines in this wavelength range, and the data is dominated by telluric absorption bands due to water, CO2 and methane. The grey regions at the edges of the waveband were discarded due to strong telluric bands of H2O and CO2 or bad pixels that are close to the edges of the detector.
Current usage metrics show cumulative count of Article Views (full-text article views including HTML views, PDF and ePub downloads, according to the available data) and Abstracts Views on Vision4Press platform.
Data correspond to usage on the plateform after 2015. The current usage metrics is available 48-96 hours after online publication and is updated daily on week days.
Initial download of the metrics may take a while.