Fig. 3
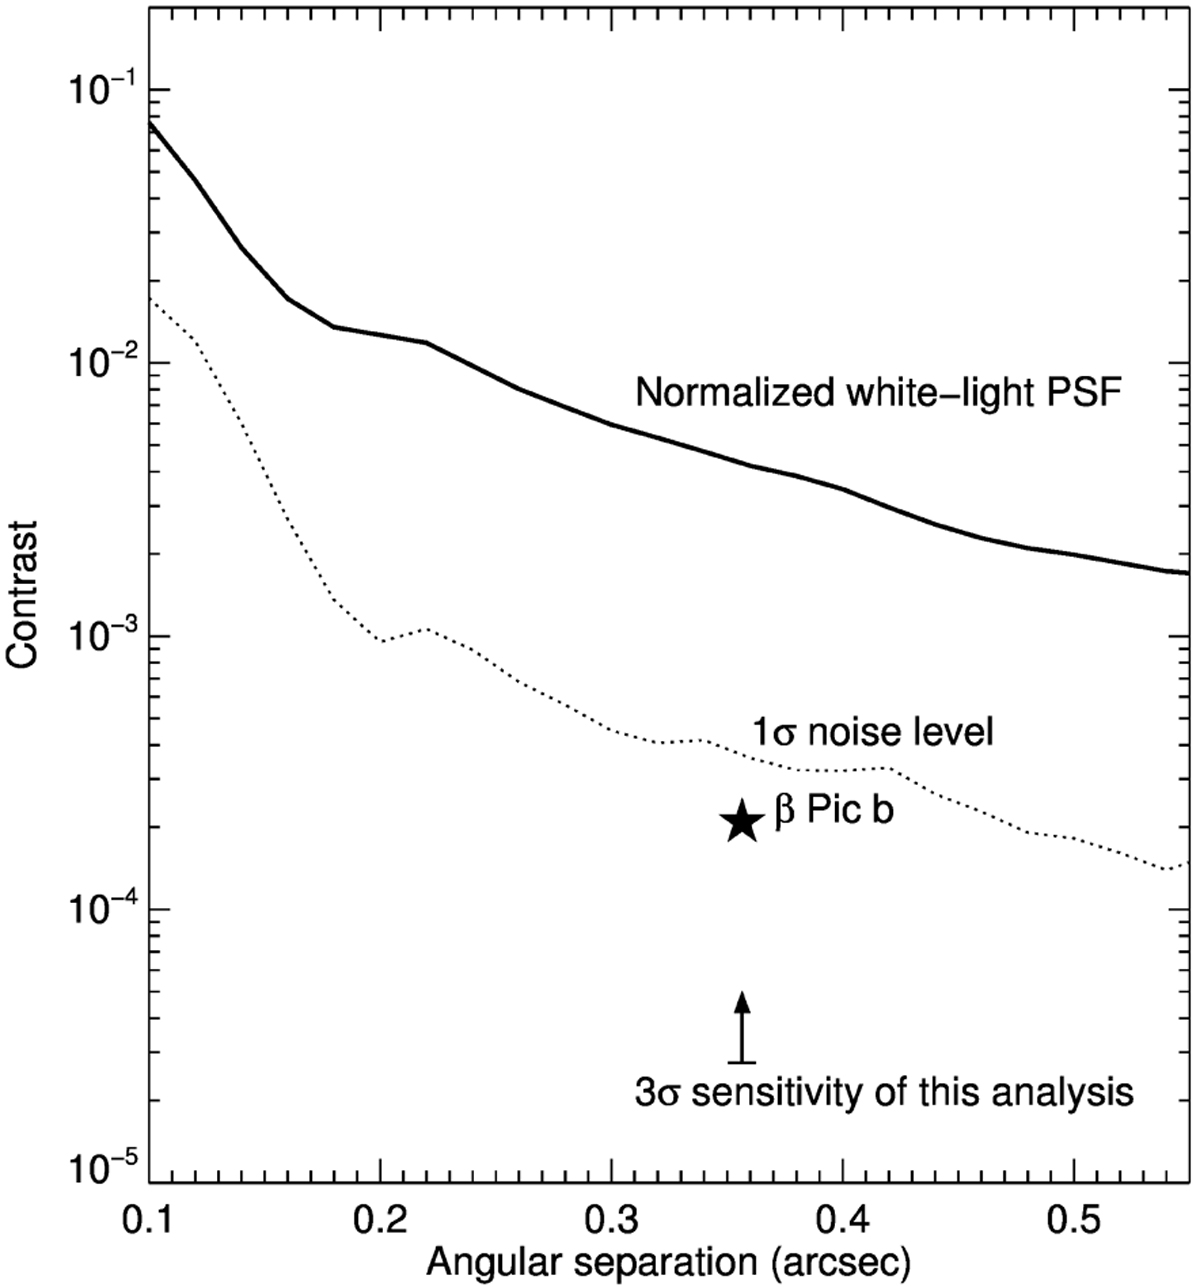
Raw-contrast curve obtained by averaging the flux from the second night in annuli with widths of20 mas around the central star, normalized by the peak flux. The standard deviation of the flux in these annuli is plotted with the dashed line, and is dominated by speckle noise. The 3σ sensitivity limit of the analysis presented in this work is derived from our S∕N = 22.8 detection of the planet, assuming that the actual K-band contrast of β Pic b is K = 9.2 (Bonnefoy et al. 2011).
Current usage metrics show cumulative count of Article Views (full-text article views including HTML views, PDF and ePub downloads, according to the available data) and Abstracts Views on Vision4Press platform.
Data correspond to usage on the plateform after 2015. The current usage metrics is available 48-96 hours after online publication and is updated daily on week days.
Initial download of the metrics may take a while.