Fig. 4
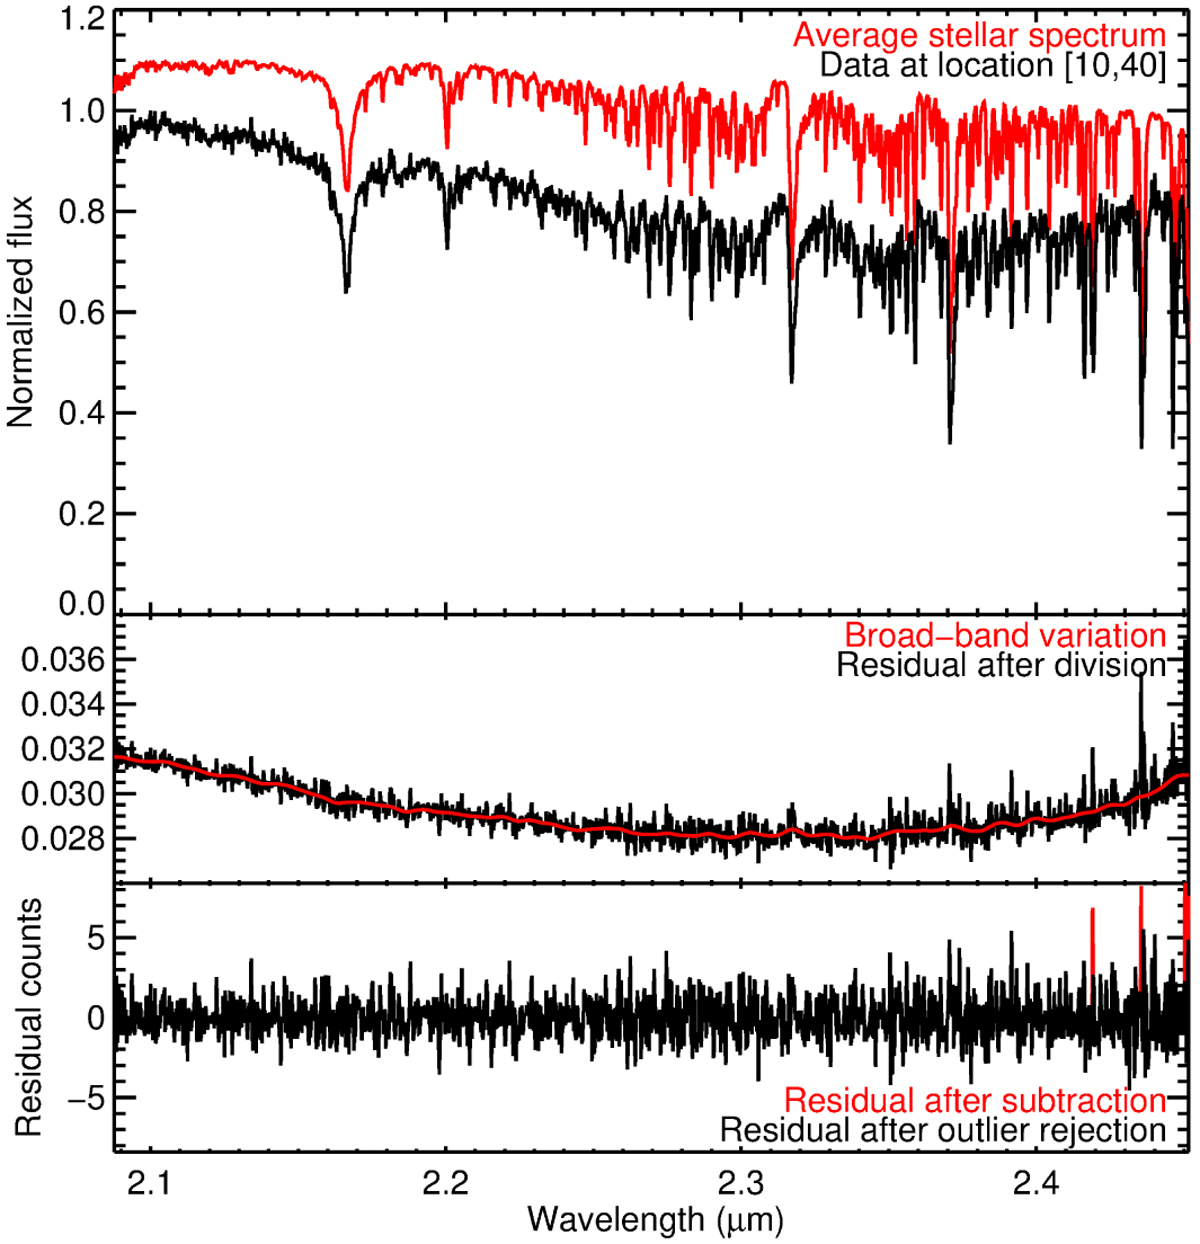
Stepwise removal of starlight from each spatial location in the data cubes. Upper panel: master stellar spectrum (red) compared to the local observed spectrum (black) at spatial pixel location [10,40] of exposure #7 of the second night. Both are normalized and offset to allow visual comparison. Middle panel: ratio of the local to the master spectrum before (black) and after Gaussian smoothing (red). This smoothed residual is used as a proxy for the local wavelength-dependence of the stellar diffraction pattern. Bottom panel: residuals obtained after subtracting the master stellar spectrum multiplied by the proxy from the local observed spectrum. Pixel values that are more than 6σ away from the mean are rejected (red). SYSREM is subsequently applied to these residuals (not shown).
Current usage metrics show cumulative count of Article Views (full-text article views including HTML views, PDF and ePub downloads, according to the available data) and Abstracts Views on Vision4Press platform.
Data correspond to usage on the plateform after 2015. The current usage metrics is available 48-96 hours after online publication and is updated daily on week days.
Initial download of the metrics may take a while.