Fig. 6
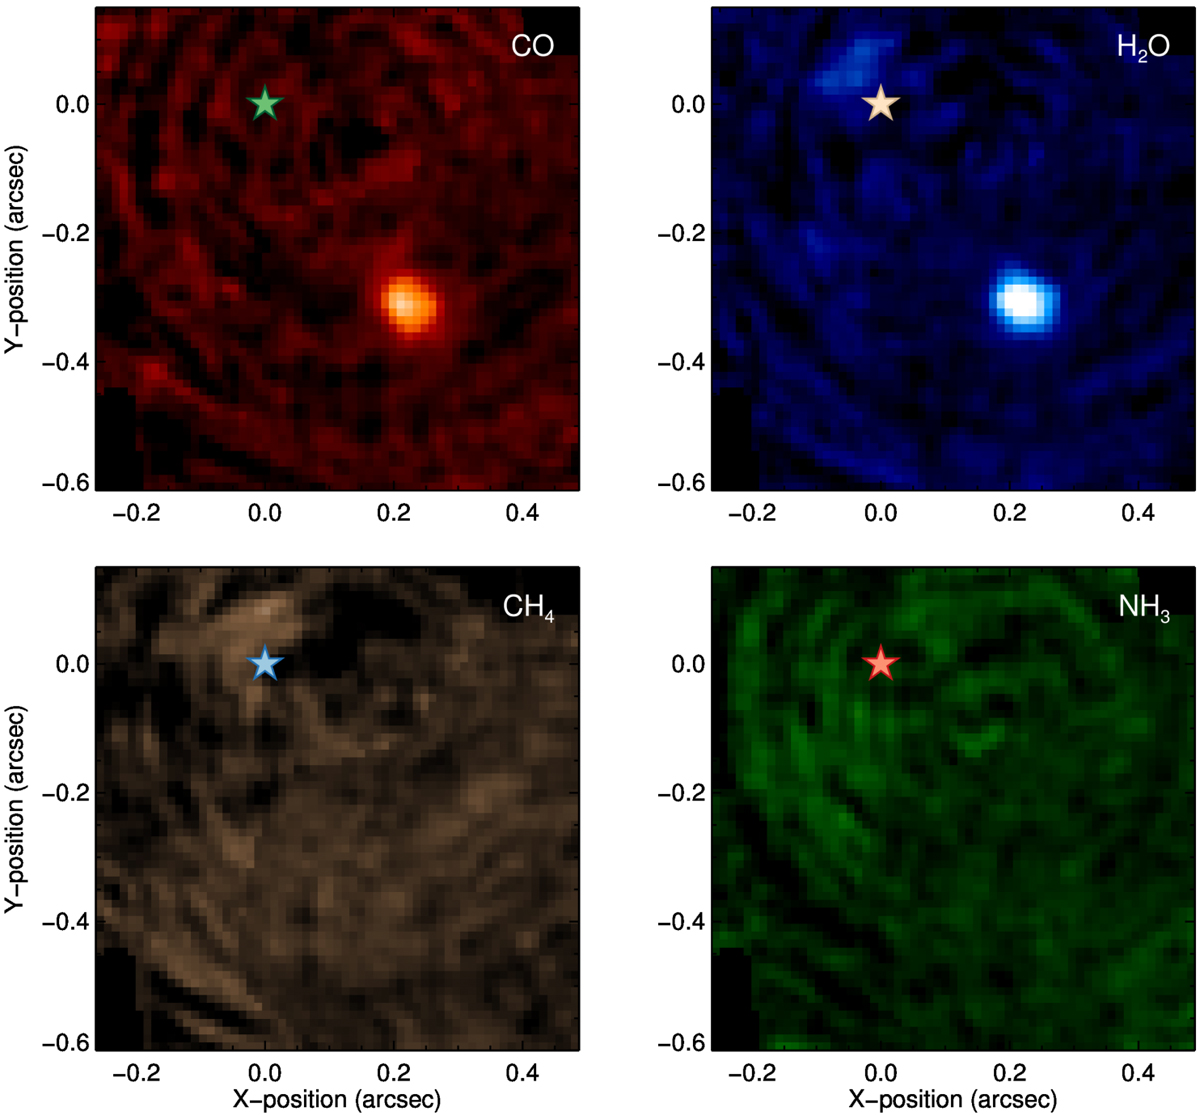
Molecule maps of CO, H2O, CH4, and NH3 at vsys = 0 km s−1. All four panels: colours scale linearly between cross-correlation values of −0.05 (black) to +0.3 (white). A cross-correlation enhancement caused by the planet is detected at S/Ns of 13.7 and 16.4 in the maps of CO and H2O respectively, but not in those of CH4 and NH3.
Current usage metrics show cumulative count of Article Views (full-text article views including HTML views, PDF and ePub downloads, according to the available data) and Abstracts Views on Vision4Press platform.
Data correspond to usage on the plateform after 2015. The current usage metrics is available 48-96 hours after online publication and is updated daily on week days.
Initial download of the metrics may take a while.