Fig. 8
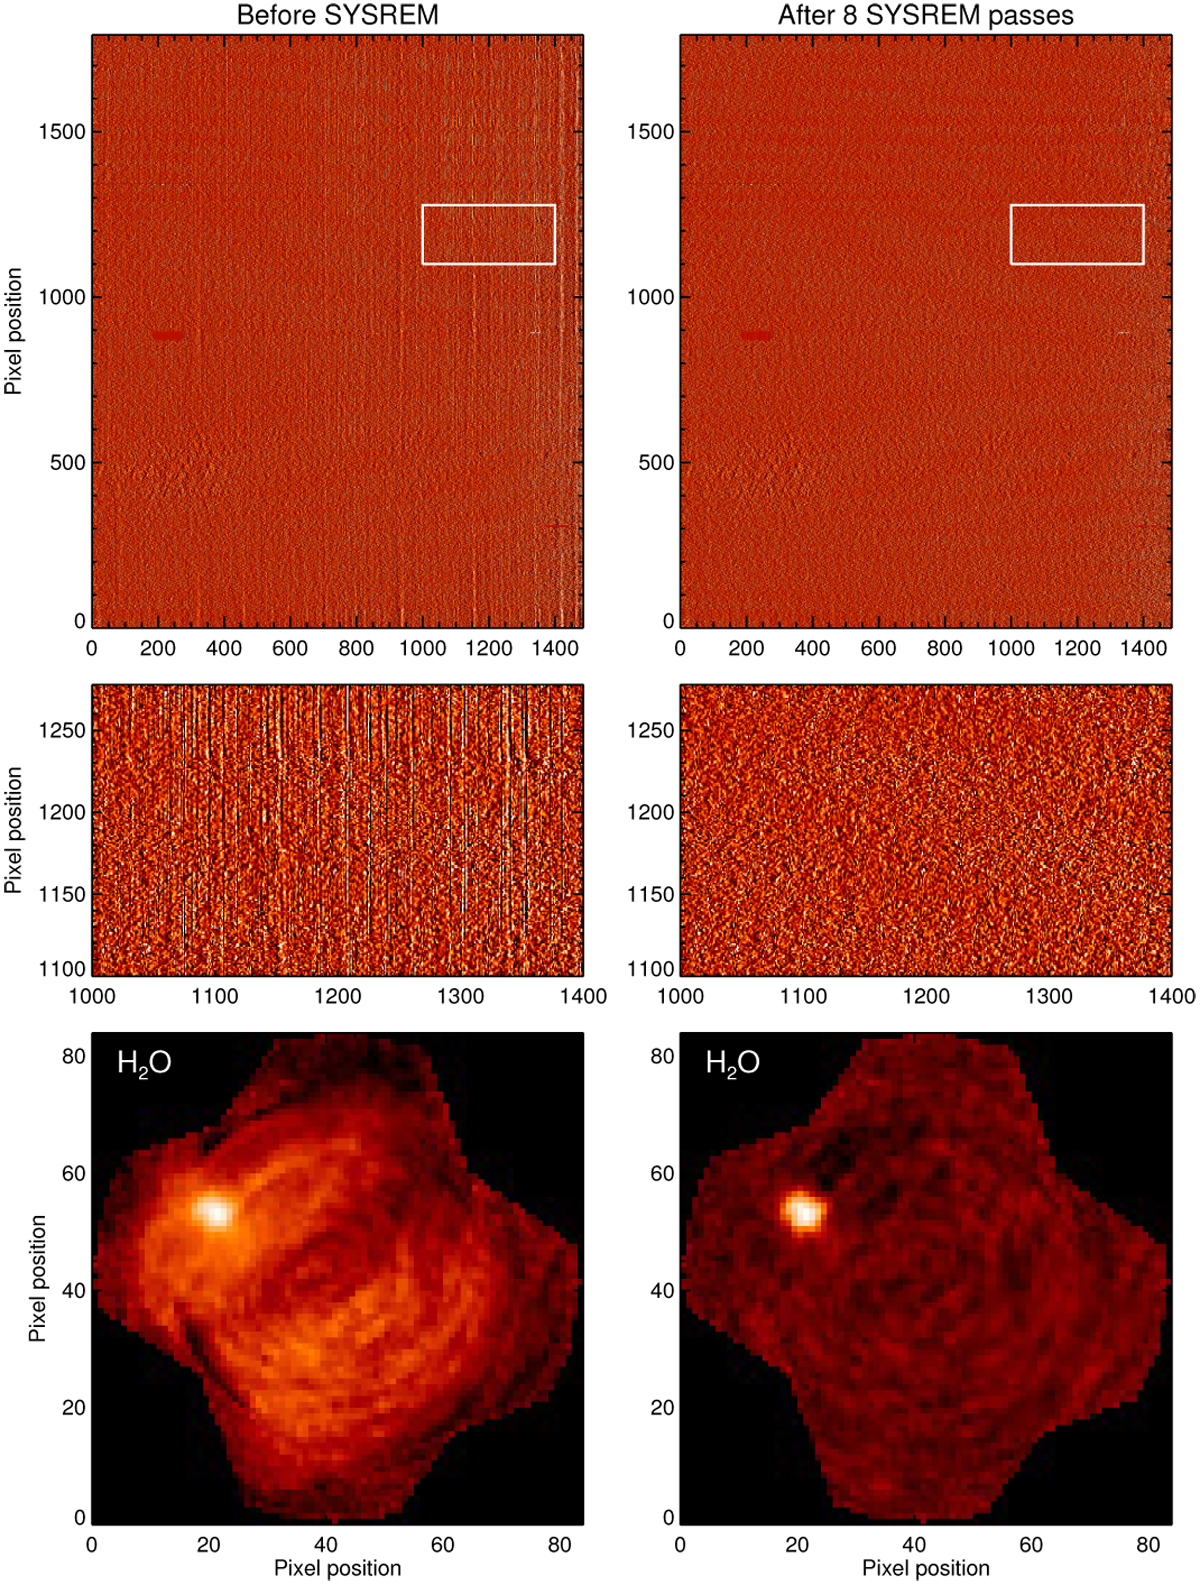
Effect of SYSREM by comparison between the un-corrected data (left panels) and the data after 8 passes through SYSREM (right panels). Upper and middle panels: unfolded residual datacubes after cleaning of the stellar spectrum. Remnants of the storng telluric CH4 feature are visibly present before application of SYSREM. The white region is enlarged in the middle panels. These areremoved after 8 passes of SYSREM (right panel). Bottom panels: cross-correlation maps of H2O obtained before (left panel) and after (right panel) SYSREM.
Current usage metrics show cumulative count of Article Views (full-text article views including HTML views, PDF and ePub downloads, according to the available data) and Abstracts Views on Vision4Press platform.
Data correspond to usage on the plateform after 2015. The current usage metrics is available 48-96 hours after online publication and is updated daily on week days.
Initial download of the metrics may take a while.