Fig. 2.
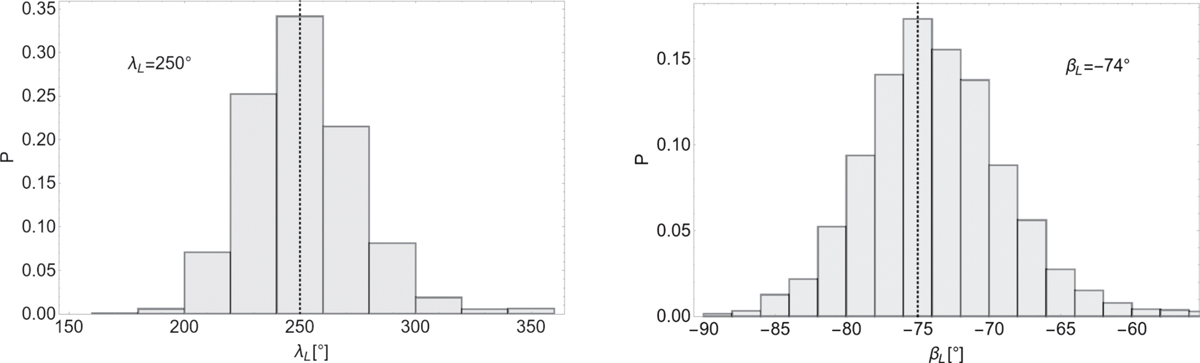
Distribution of the values of the ecliptic longitude λL (left panel) and latitude βL (right panel) of Apophis polar axis from our set of 10 000 points in the polygonal zone delimited by Pravec et al. (2014). The dotted line corresponds to the nominal value in this paper, mentioned in the figure. The grey bin corresponds to the peak of the distribution.
Current usage metrics show cumulative count of Article Views (full-text article views including HTML views, PDF and ePub downloads, according to the available data) and Abstracts Views on Vision4Press platform.
Data correspond to usage on the plateform after 2015. The current usage metrics is available 48-96 hours after online publication and is updated daily on week days.
Initial download of the metrics may take a while.