Open Access
Fig. 2.
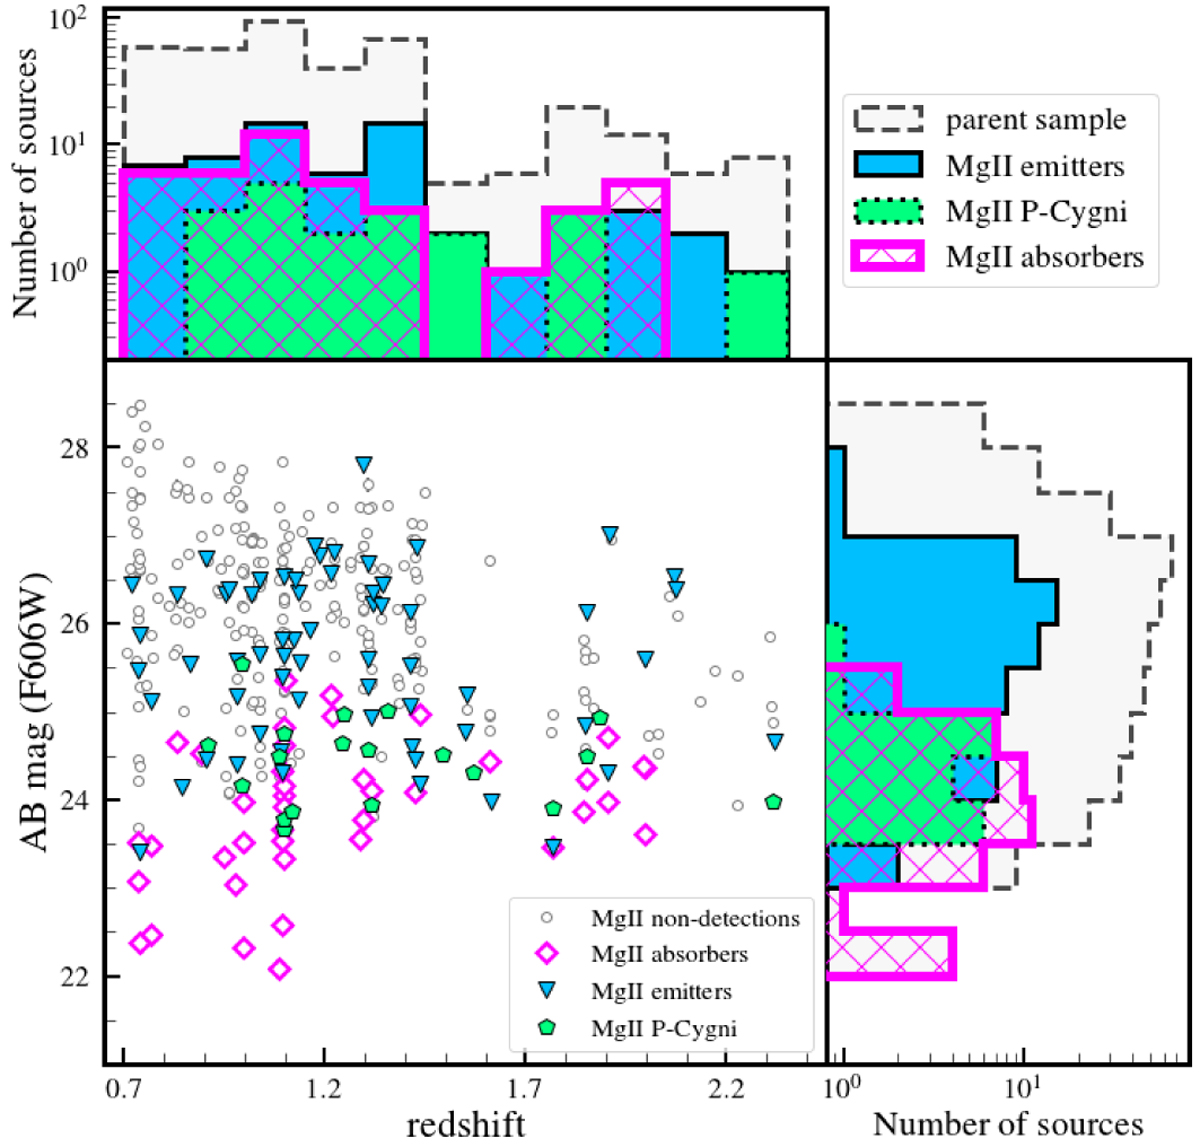
Redshift (top panel) and F606W HST passband filter flux (right panel) distributions for the whole Mg II parent sample (dashed dark gray histrogram). As labeled in the legend, distributions of Mg II emitters, P-Cygni, and absorbers are shown in cyan, green, and magenta histograms, respectively.
Current usage metrics show cumulative count of Article Views (full-text article views including HTML views, PDF and ePub downloads, according to the available data) and Abstracts Views on Vision4Press platform.
Data correspond to usage on the plateform after 2015. The current usage metrics is available 48-96 hours after online publication and is updated daily on week days.
Initial download of the metrics may take a while.