Fig. 3.
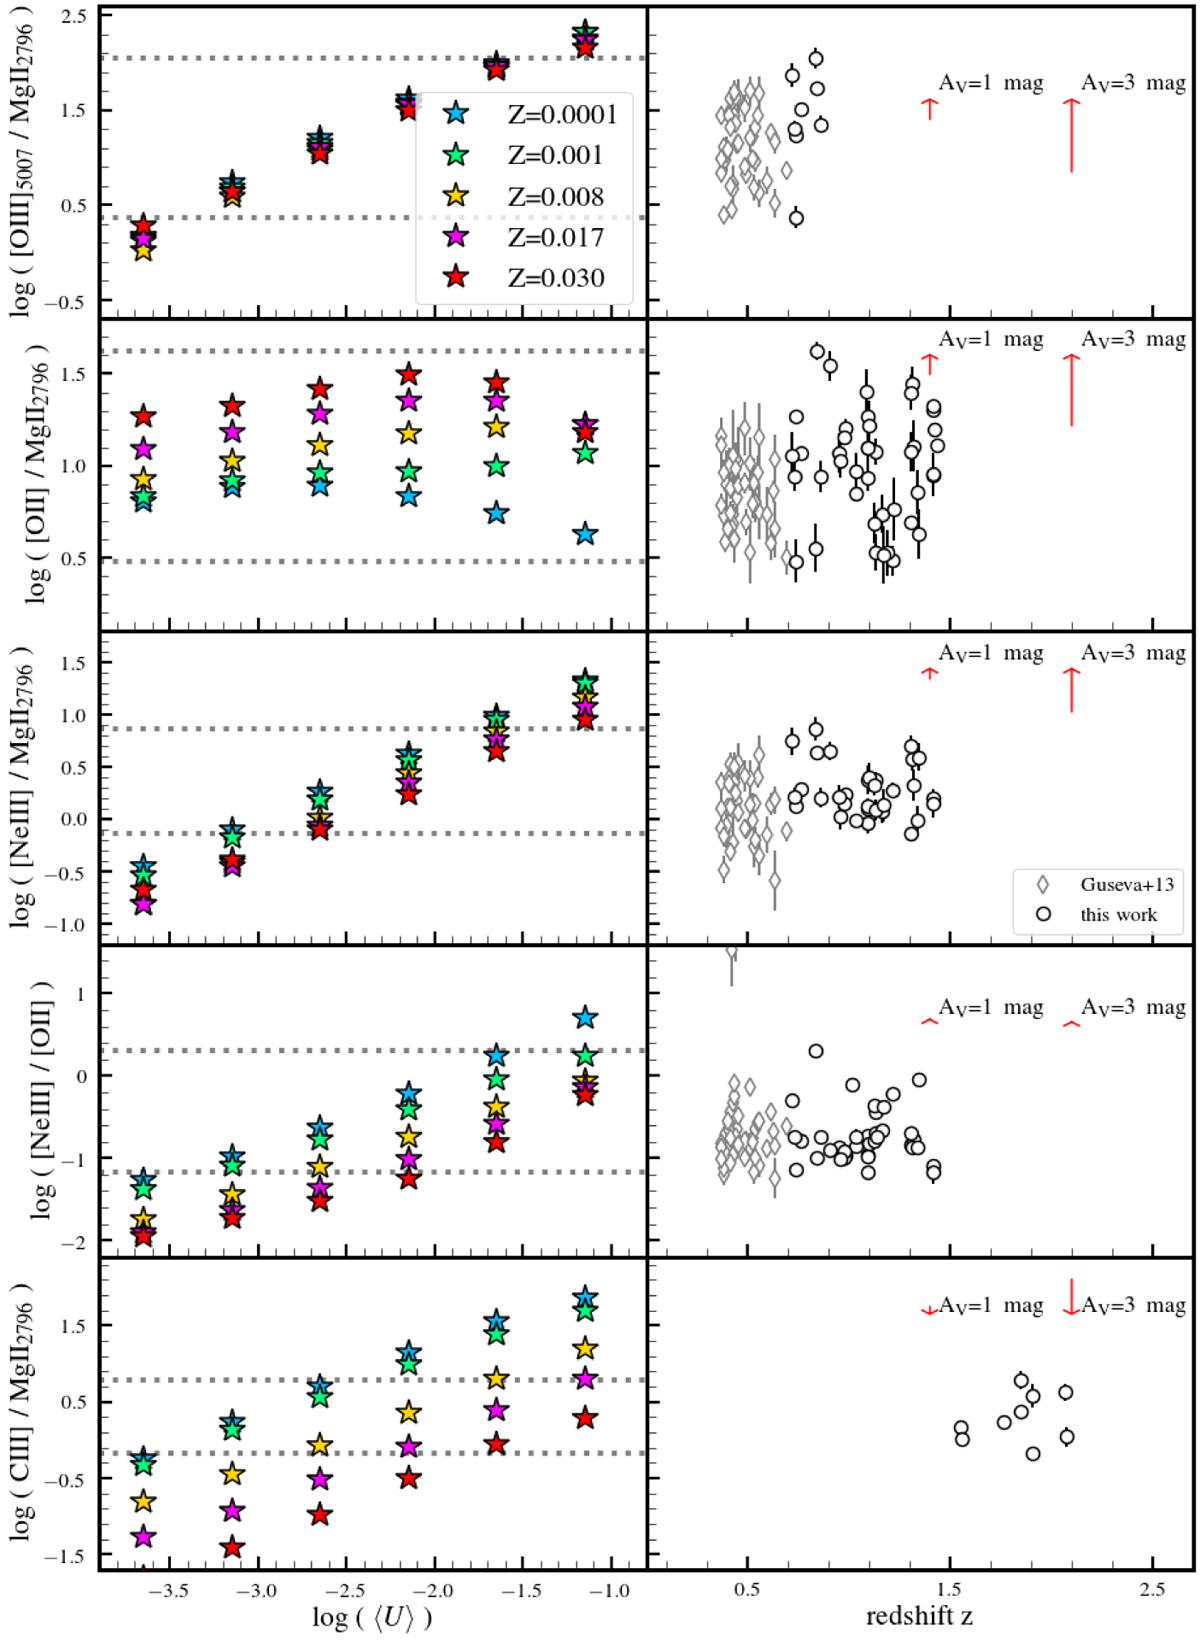
Comparison of observed line emissions with predictions from photoionization models. Left: [O III]λ5007/Mg IIλ2796, [O II]/Mgiiλ2796, [Ne III]/Mg IIλ2796, [Ne III]/[O II], and C III]/Mg IIλ2796 emission-line ratios predicted from the star-forming galaxy models of Gutkin et al. (2016), described in Sect. 3.1, for different values of the volume-averaged ionization parameter log 〈U〉 (x-axis) and metallicity Z (color-coded as indicated in the top panel). Dotted gray lines mark the minimum and maximum value of the line ratios measured from the MUSE spectra of Mg II emitters. Right (from top to bottom): observed line ratios as function of redshift for the Mg II emitters, as defined in Sect. 2.3 (empty black circles) and for the sample of Guseva et al. (2013; empty gray diamonds). Red arrows in the top right corner of each panel indicate the effect of attenuation by dust for Av = 1 and 3 mag and a Calzetti et al. (2000) attenuation curve. Data measurements from Guseva et al. (2013) have been corrected for dust attenuation, whereas the MUSE fluxes have not been.
Current usage metrics show cumulative count of Article Views (full-text article views including HTML views, PDF and ePub downloads, according to the available data) and Abstracts Views on Vision4Press platform.
Data correspond to usage on the plateform after 2015. The current usage metrics is available 48-96 hours after online publication and is updated daily on week days.
Initial download of the metrics may take a while.