Fig. 4.
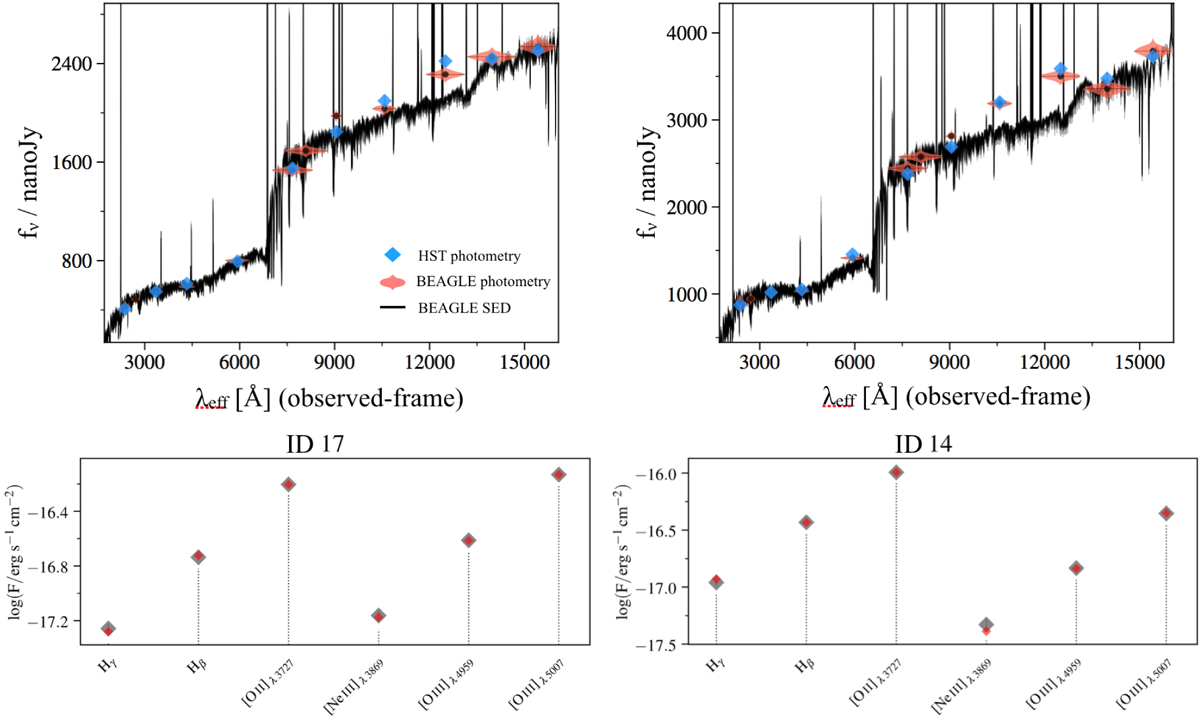
Example of a simultaneous BEAGLE fit to HST photometry (top panel) and MUSE integrated fluxes (bottom panel) for the Mg II emitter ID17 at z = 0.84 (left panel) and Mg II absorbers ID14 at z = 0.77 (right panel). Top panel: HST (cyan diamonds) and predicted (black points and shaded red area) broad-band photometry. In black we show the full SED predicted from the BEAGLE fit. Bottom panel: integrated fluxes measured from MUSE spectra (red diamonds) and from the SED predicted by BEAGLE (gray diamonds). Error bars on the data points are contained within the markers.
Current usage metrics show cumulative count of Article Views (full-text article views including HTML views, PDF and ePub downloads, according to the available data) and Abstracts Views on Vision4Press platform.
Data correspond to usage on the plateform after 2015. The current usage metrics is available 48-96 hours after online publication and is updated daily on week days.
Initial download of the metrics may take a while.