Fig. 6.
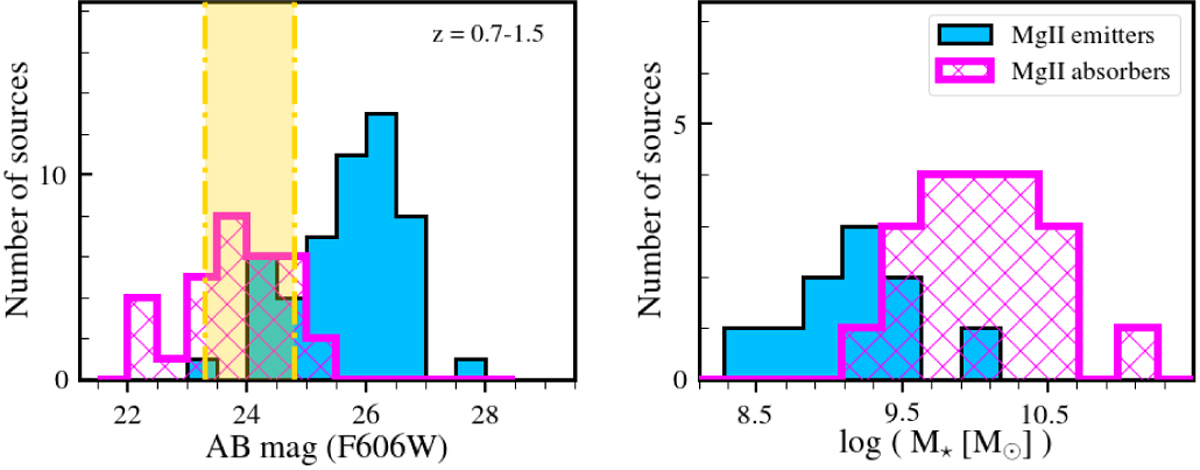
Left panel: F606W passband filter flux distribution for Mg II emitters and absorbers (cyan and magenta histograms, respectively) in the redshift range 0.7 < z < 1.5. Right panel: stellar mass distributions of Mg II emitters and absorbers (same color-code as the left panel) with a given range of F606W flux, as highlighted in yellow in the left panel.
Current usage metrics show cumulative count of Article Views (full-text article views including HTML views, PDF and ePub downloads, according to the available data) and Abstracts Views on Vision4Press platform.
Data correspond to usage on the plateform after 2015. The current usage metrics is available 48-96 hours after online publication and is updated daily on week days.
Initial download of the metrics may take a while.