Fig. 9.
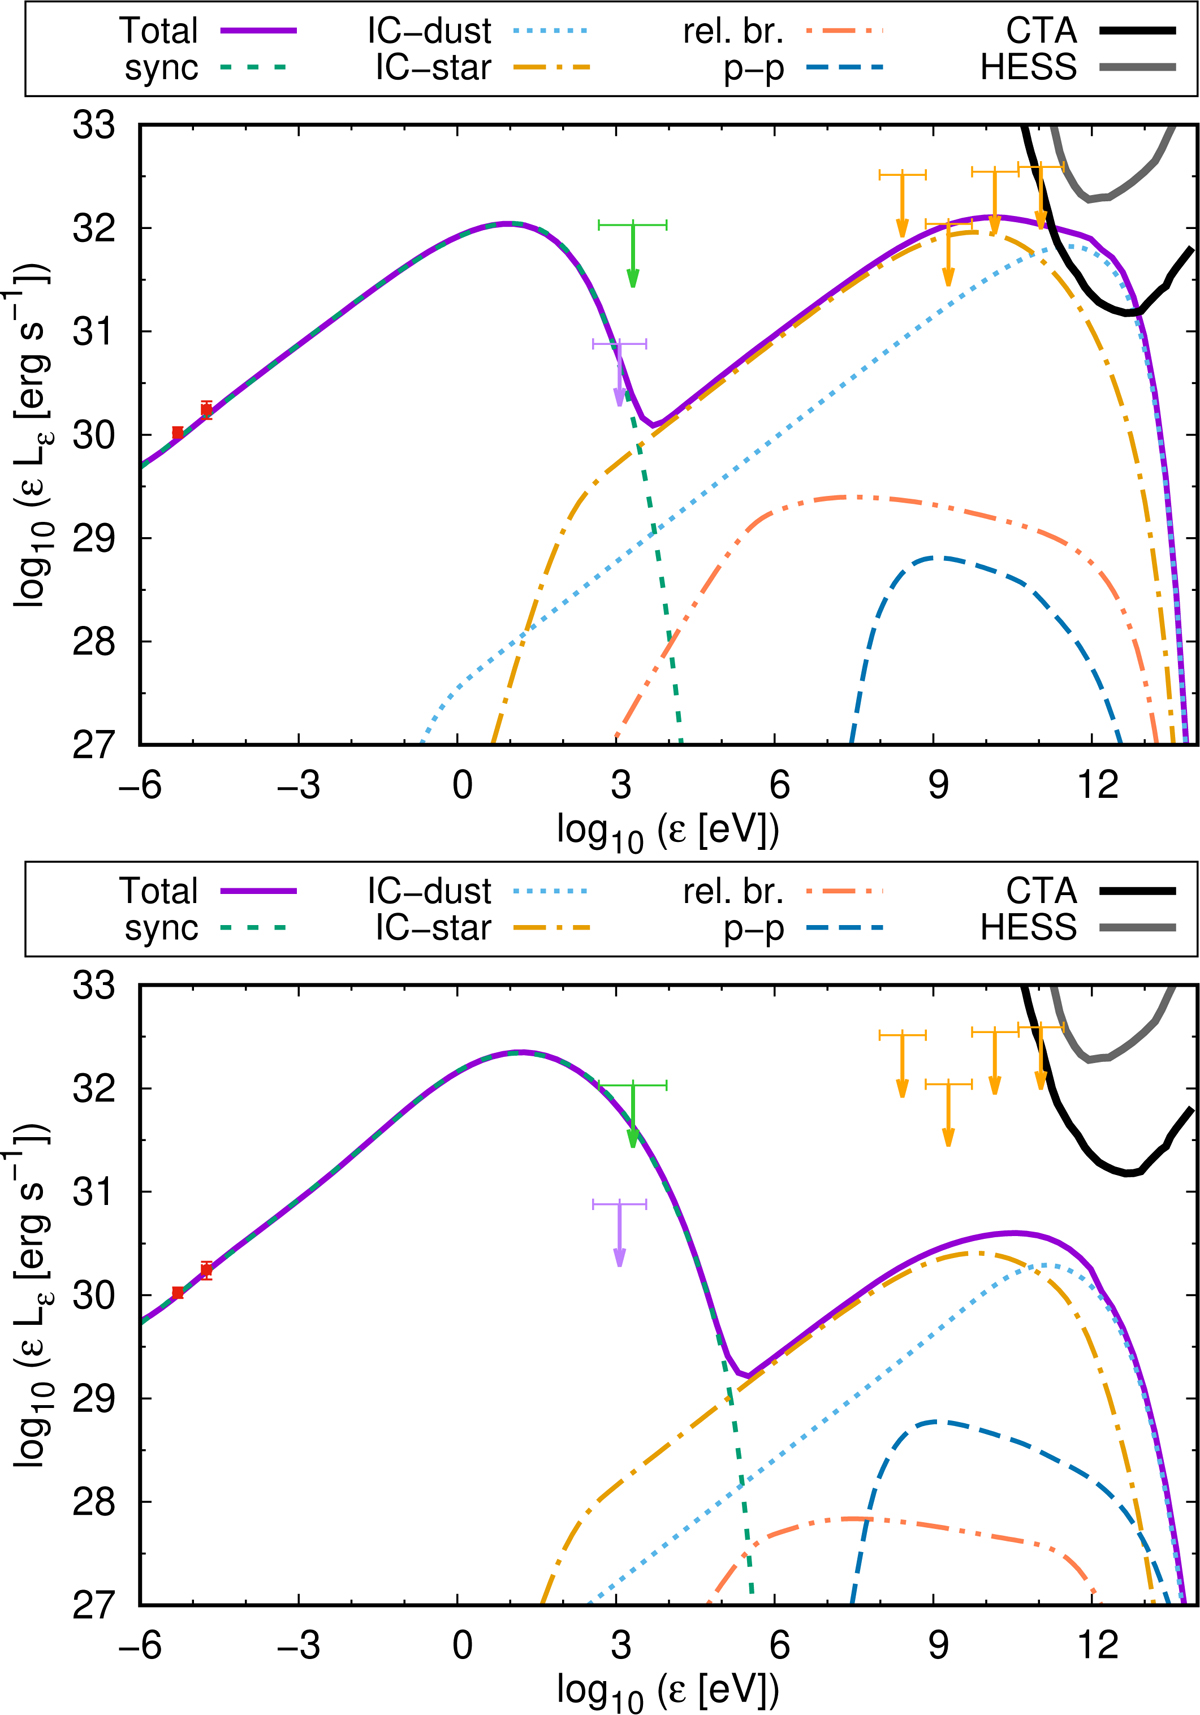
SED for a low (top panel) and a high magnetic field scenario (bottom panel). The red dots represent the VLA flux (Benaglia et al. 2010), the green arrow is the Suzaku upper-limit (UL) in 0.3–10 keV (Terada et al. 2012), the purple arrow the XMM-Newton UL in 0.4–4 keV (Toalá et al. 2016), the orange arrows the Fermi UL in 0.1–300 GeV (Schulz et al. 2014). The grey and black solid lines are the instrument sensitivities for 100-h HESS and 100-h CTA, respectively (Funk et al. 2013).
Current usage metrics show cumulative count of Article Views (full-text article views including HTML views, PDF and ePub downloads, according to the available data) and Abstracts Views on Vision4Press platform.
Data correspond to usage on the plateform after 2015. The current usage metrics is available 48-96 hours after online publication and is updated daily on week days.
Initial download of the metrics may take a while.