Fig. 1
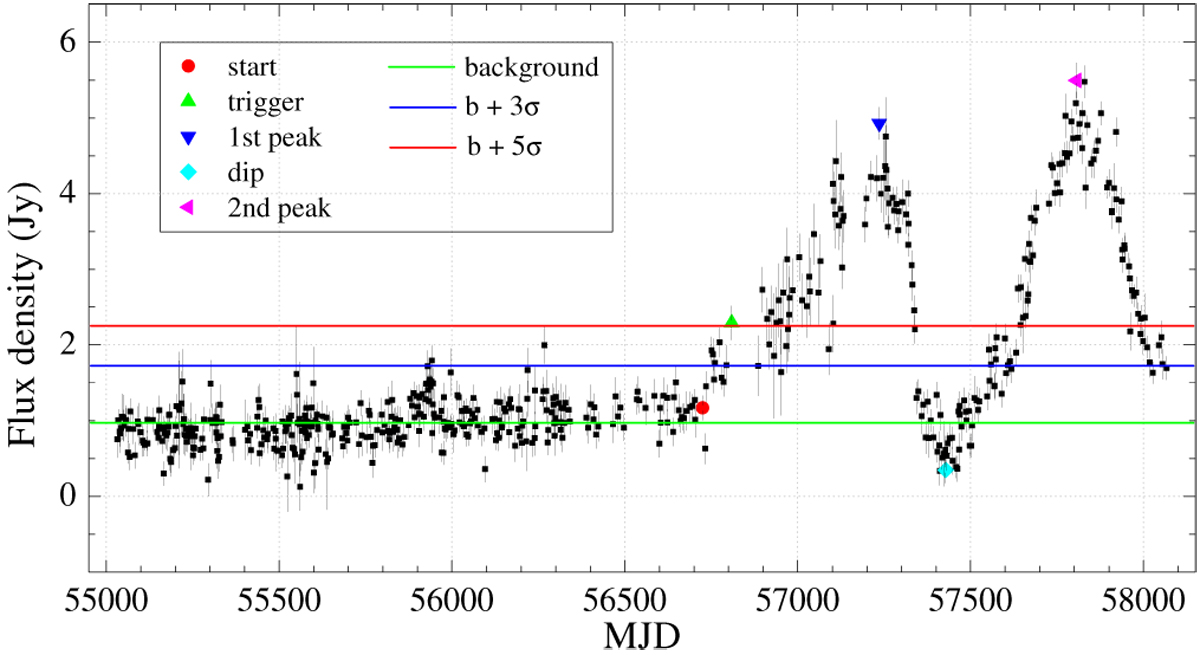
Typical 6.7 GHz light curve for the 2.87 km s−1 spectral channel of S255-NIRS3. The green line denotes the estimated background (b) flux level, while the blue and red lines indicate variations above the background by 3σ and 5σ, respectively.The symbols in the legend indicate the start of the burst, the data point triggering the burst, the first and second peaks of the burst, and the dip of the light curve.
Current usage metrics show cumulative count of Article Views (full-text article views including HTML views, PDF and ePub downloads, according to the available data) and Abstracts Views on Vision4Press platform.
Data correspond to usage on the plateform after 2015. The current usage metrics is available 48-96 hours after online publication and is updated daily on week days.
Initial download of the metrics may take a while.