Fig. 4
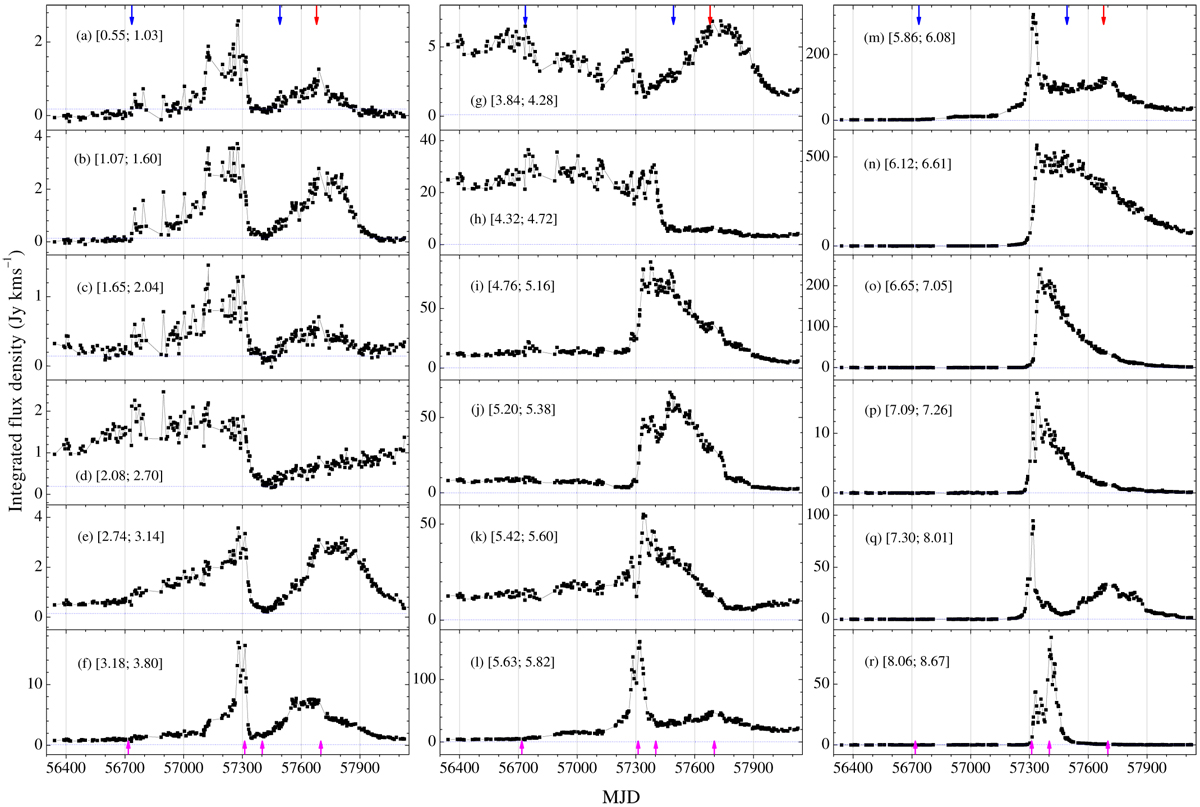
Burst profiles of the 6.7 GHz methanol emission. The time series of the integrated flux density for 18 distinct velocity intervals are shown. The velocity intervals, given between square brackets at the top left of each panel, are selected in order to visualize the substantial changes in maser intensity and largely correspond to the widths of individual spectral features. The dotted line in each panel marks the 1σ level. The consecutive magenta arrows above the bottom abscissa denote the approximate times of the start, (MJD ~56716), the first peak (MJD ~57310), the dip (MJD ~57400), and the second peak (MJD ~57700) of the burst. The red and blue arrows show the dates of JVLA (see Fig. 7) and VLBI (see Fig. 9) observations, respectively.
Current usage metrics show cumulative count of Article Views (full-text article views including HTML views, PDF and ePub downloads, according to the available data) and Abstracts Views on Vision4Press platform.
Data correspond to usage on the plateform after 2015. The current usage metrics is available 48-96 hours after online publication and is updated daily on week days.
Initial download of the metrics may take a while.