Fig. 5
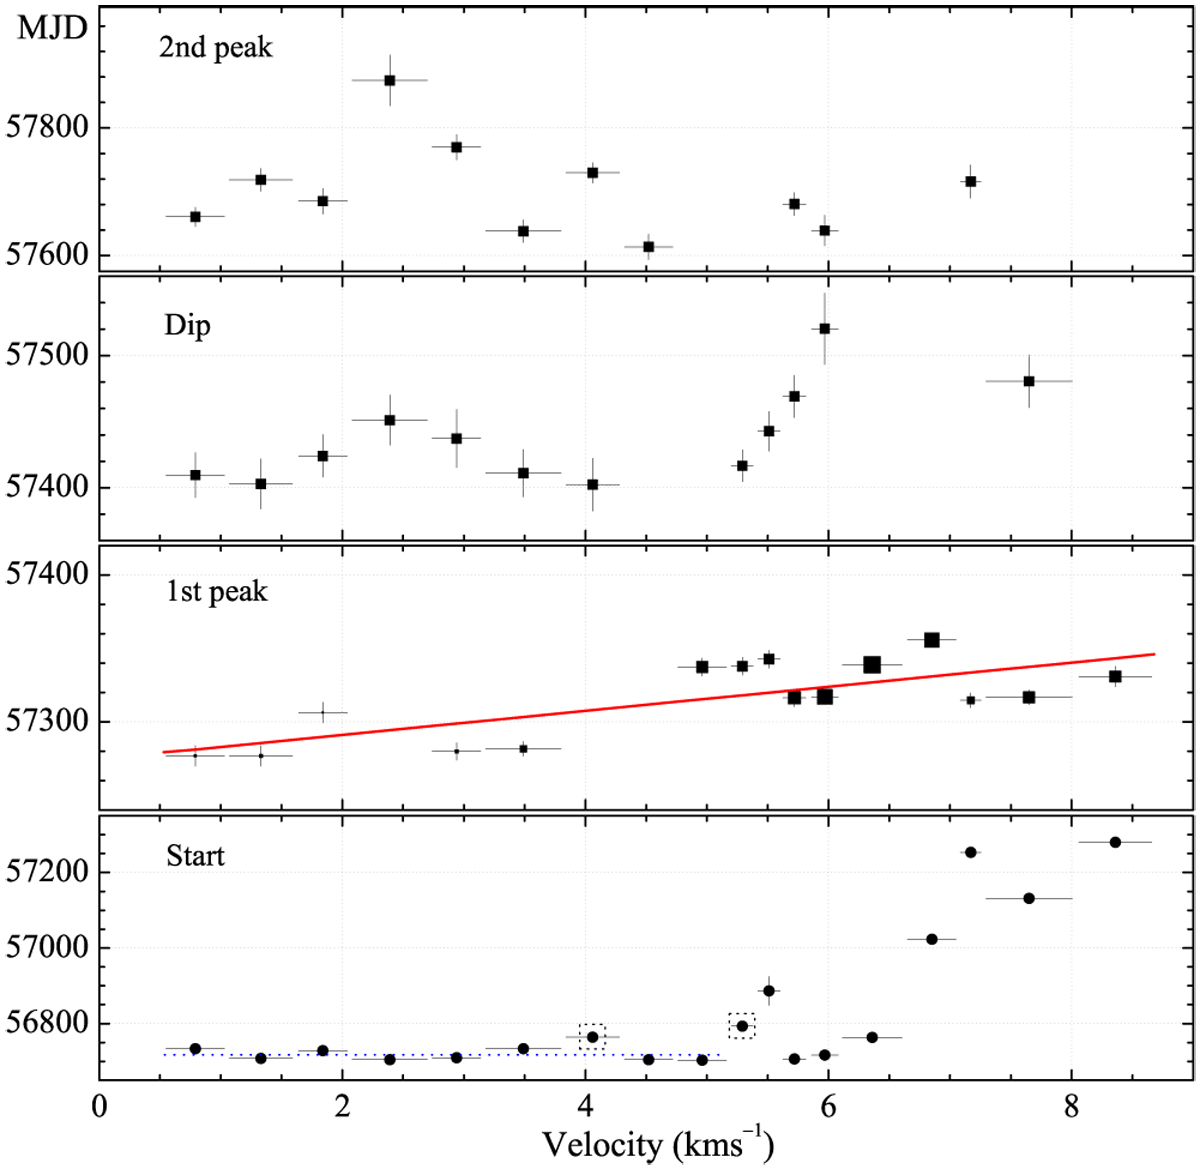
Timing characteristics of the burst vs. radial velocity. Shown are the times of start, first peak, dip, and second peak obtained by averaging the light curves over the same velocity intervals as in Fig. 4. All the horizontal bars denote the widths of these velocity intervals. Bottom panel: errors for the start time are smaller than or comparable to the symbol size, the dotted line indicates the average time of the burst onset for the persistent emission, and the two data points surrounded by dotted square denote the beginning of decline in intensity. Second (from bottom) panel: symbol sizes are proportional to the logarithm of the peak-integrated flux density, and the red line shows the linear fit to the time of the first peak vs. velocity.
Current usage metrics show cumulative count of Article Views (full-text article views including HTML views, PDF and ePub downloads, according to the available data) and Abstracts Views on Vision4Press platform.
Data correspond to usage on the plateform after 2015. The current usage metrics is available 48-96 hours after online publication and is updated daily on week days.
Initial download of the metrics may take a while.