Free Access
Fig. 6
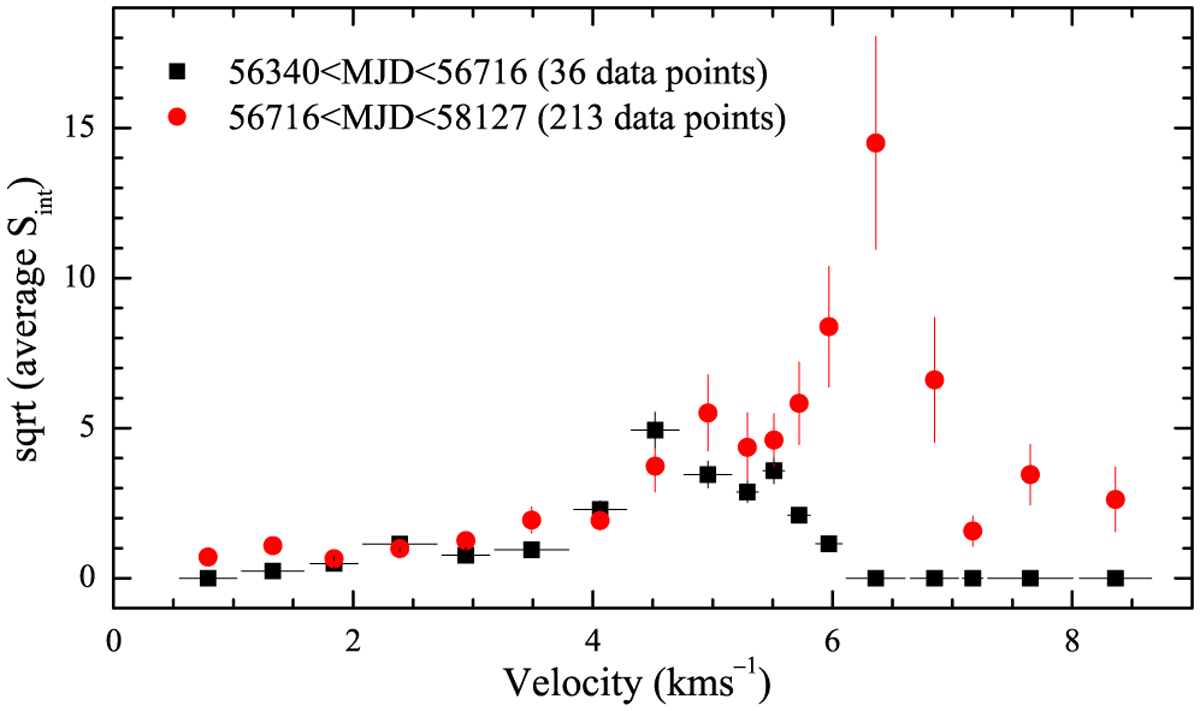
Integrated flux density (Sint) before (black squares) and during the burst (red circles). The root square of mean Sint over the same velocity intervals as in Fig. 4 is shown. The time spans and the number of data points are given in the legend.
Current usage metrics show cumulative count of Article Views (full-text article views including HTML views, PDF and ePub downloads, according to the available data) and Abstracts Views on Vision4Press platform.
Data correspond to usage on the plateform after 2015. The current usage metrics is available 48-96 hours after online publication and is updated daily on week days.
Initial download of the metrics may take a while.