Fig. 7
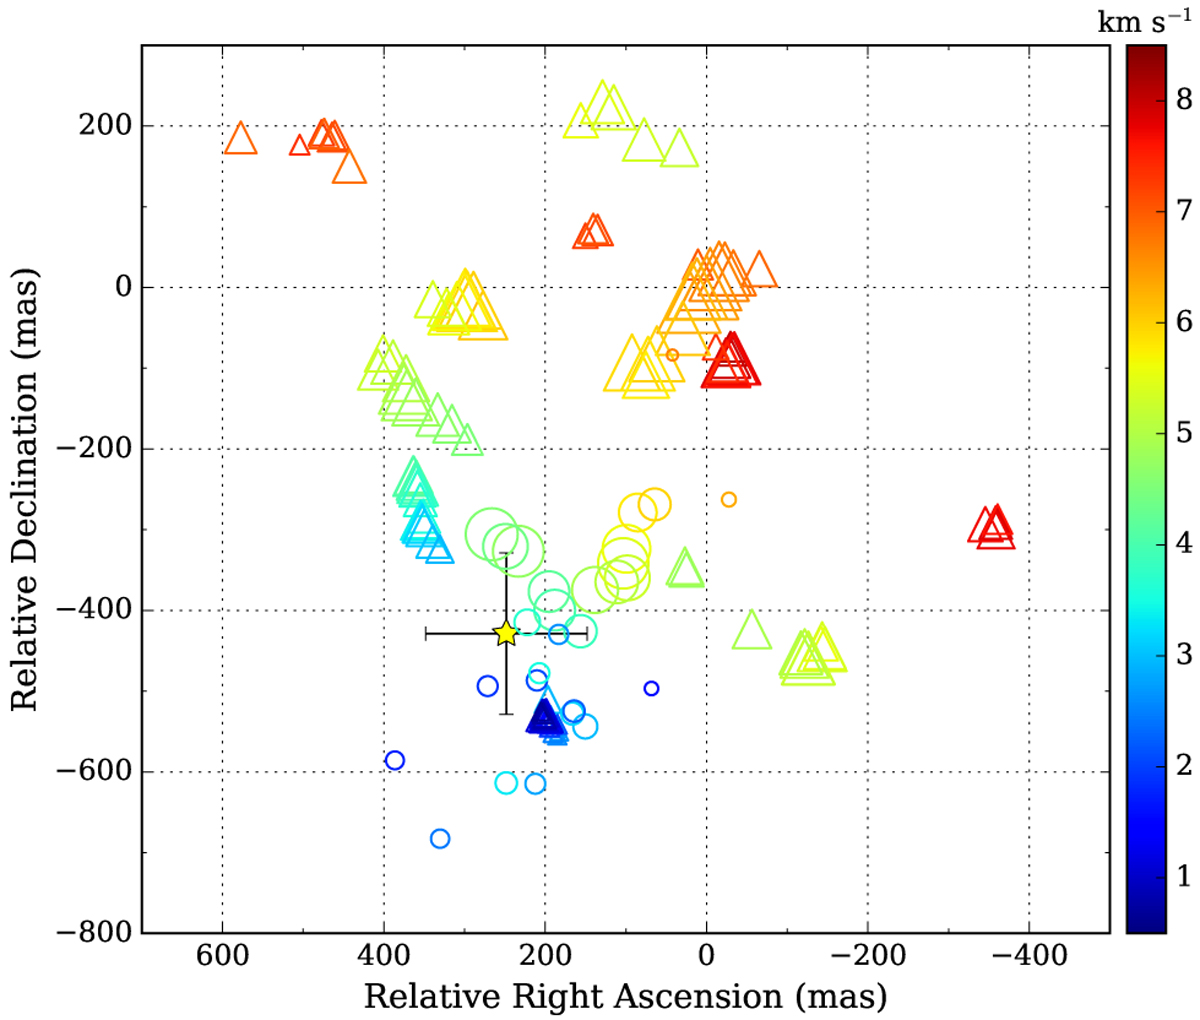
Distribution of the 6.7 GHz methanol maser spots in S255IR IRS3 taken before (circles) and after (triangles) the burst on MJD 55996 (JVLA-C; Hu et al. 2016) and MJD 57676 (JVLA-A; Moscadelli et al. 2017), respectively. The origin of the map coincides with the brightest spot at α(J2000) = 06h 12m53. s998, Δ(J2000)= 17°59′23.′′49. The relative position uncertainty of the spots between these two epochs is less than ~0.′′1. The symbol size is proportional to the maser brightness, and colors denote the radial velocity in km s−1 according tothe right scale. The cross marks the position of the 5 GHz continuum emission (Moscadelli et al. 2017).
Current usage metrics show cumulative count of Article Views (full-text article views including HTML views, PDF and ePub downloads, according to the available data) and Abstracts Views on Vision4Press platform.
Data correspond to usage on the plateform after 2015. The current usage metrics is available 48-96 hours after online publication and is updated daily on week days.
Initial download of the metrics may take a while.