Fig. 9
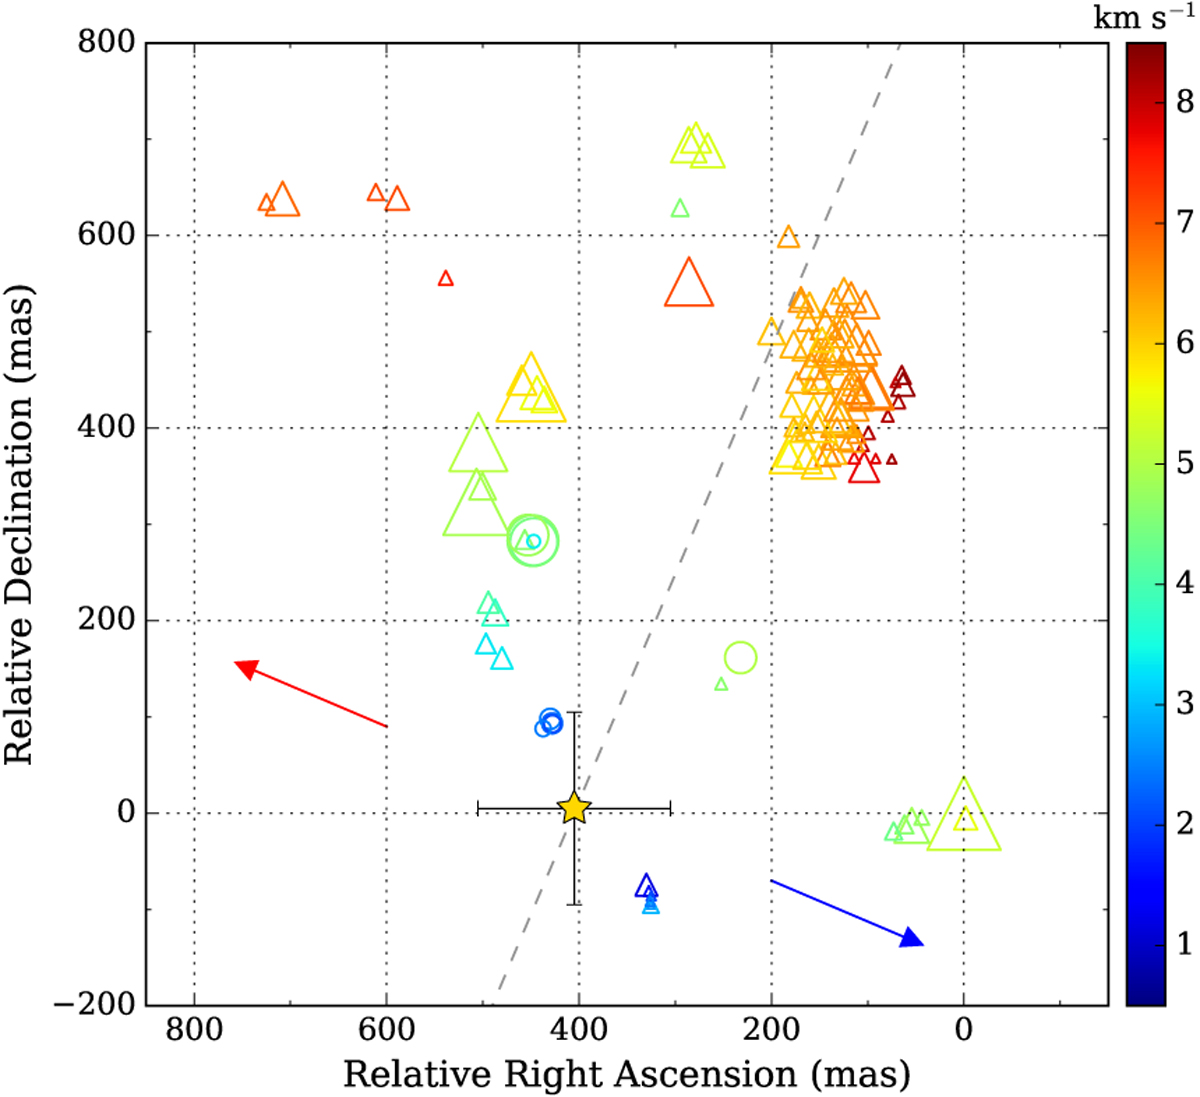
Distribution of the 6.7 GHz methanol maser spots in S255IR IRS3 taken on MJD 56736 (circles, http://bessel.vlbi-astrometry.org/data) and MJD 57490 (triangles; Moscadelli et al. 2017) using the VLBA and EVN, respectively.The relative position uncertainty of the spots between these two epochs is less than a few tens of mas. The symbol size is proportional to the maser brightness, and colors denote the radial velocity in kilometer per second according to the right scale. The cross marks the position of the 5 GHz continuum emission (Moscadelli et al. 2017). The dotted gray line marks the major axis of the disk, whereas the arrows indicates the blue- and redshifted lobes of large-scale CO outflow (Zinchenko et al. 2015).
Current usage metrics show cumulative count of Article Views (full-text article views including HTML views, PDF and ePub downloads, according to the available data) and Abstracts Views on Vision4Press platform.
Data correspond to usage on the plateform after 2015. The current usage metrics is available 48-96 hours after online publication and is updated daily on week days.
Initial download of the metrics may take a while.