Fig. 7.
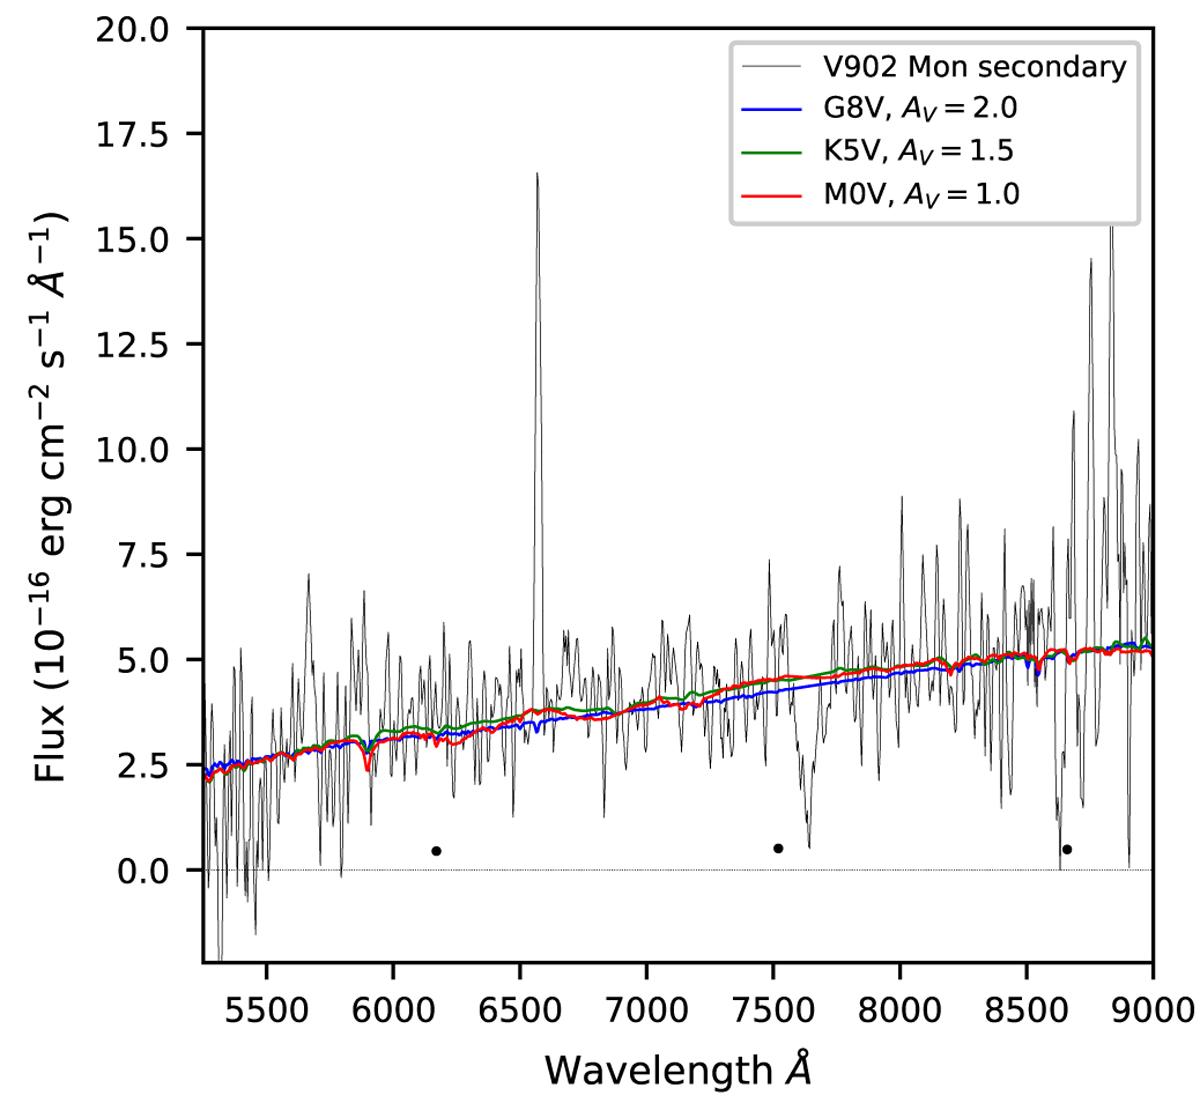
Mean eclipse spectrum (black curve) of V902 Mon and a range of stellar spectra from Pickles (1998) for several values of visual extinction AV. The telluric lines around 7600 Å have not been corrected in the V902 Mon spectrum, and the Hα line is very prominent. The large black points represent the maximum possible contamination due to the nearby faint star, based on its Pan-STARRS magnitudes in the r, i, z filters, and this contribution is included in the stellar spectra shown.
Current usage metrics show cumulative count of Article Views (full-text article views including HTML views, PDF and ePub downloads, according to the available data) and Abstracts Views on Vision4Press platform.
Data correspond to usage on the plateform after 2015. The current usage metrics is available 48-96 hours after online publication and is updated daily on week days.
Initial download of the metrics may take a while.