Fig. 11.
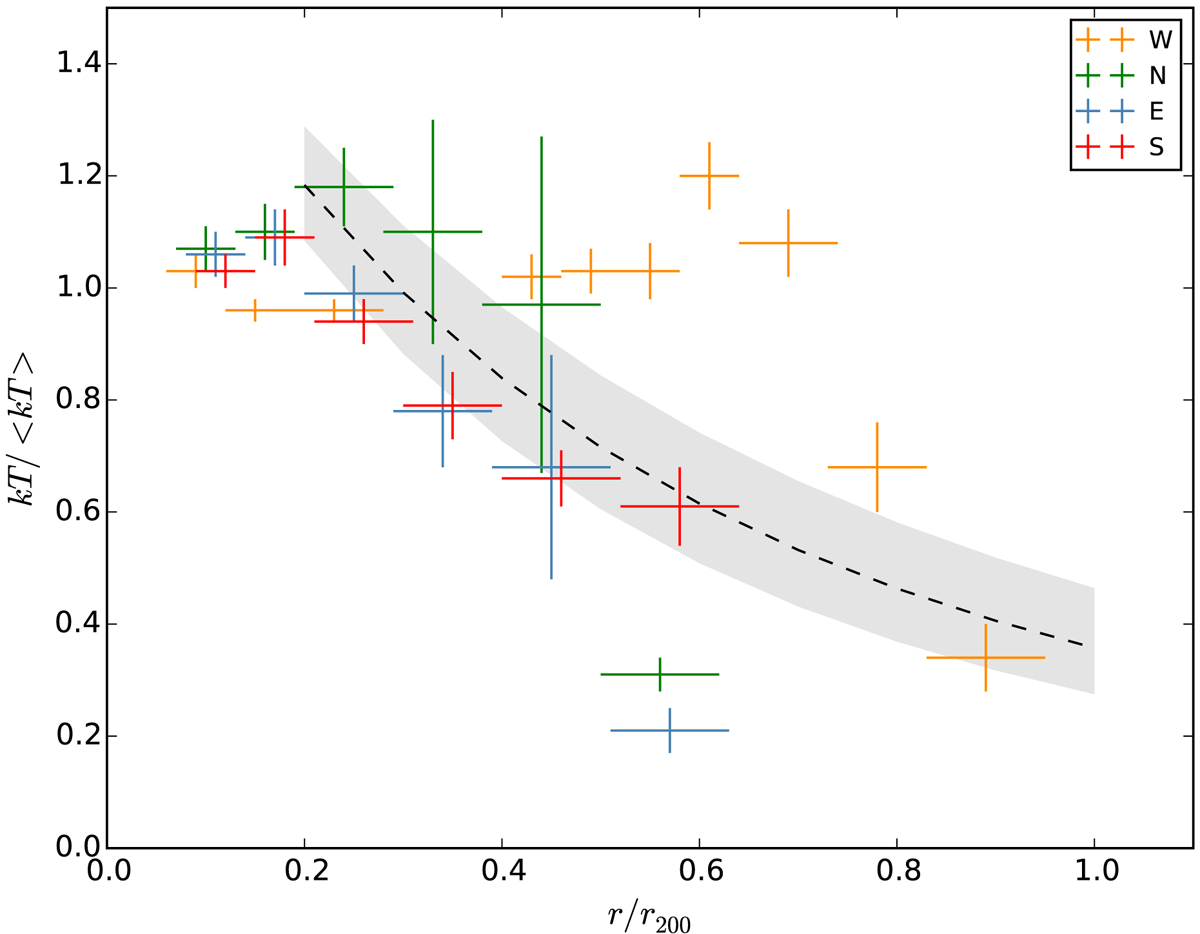
Normalized radial temperature profile of A3376 compared with relaxed clusters. The dashed line represents the Burns et al. (2010) universal profile and the gray area shows its standard deviation. The orange, green, blue and red crosses are the scaled data for the west, north, east, and south directions, respectively. We have shifted these scaled data of the different directions in r/r200 for clarity purpose.
Current usage metrics show cumulative count of Article Views (full-text article views including HTML views, PDF and ePub downloads, according to the available data) and Abstracts Views on Vision4Press platform.
Data correspond to usage on the plateform after 2015. The current usage metrics is available 48-96 hours after online publication and is updated daily on week days.
Initial download of the metrics may take a while.