Fig. 1
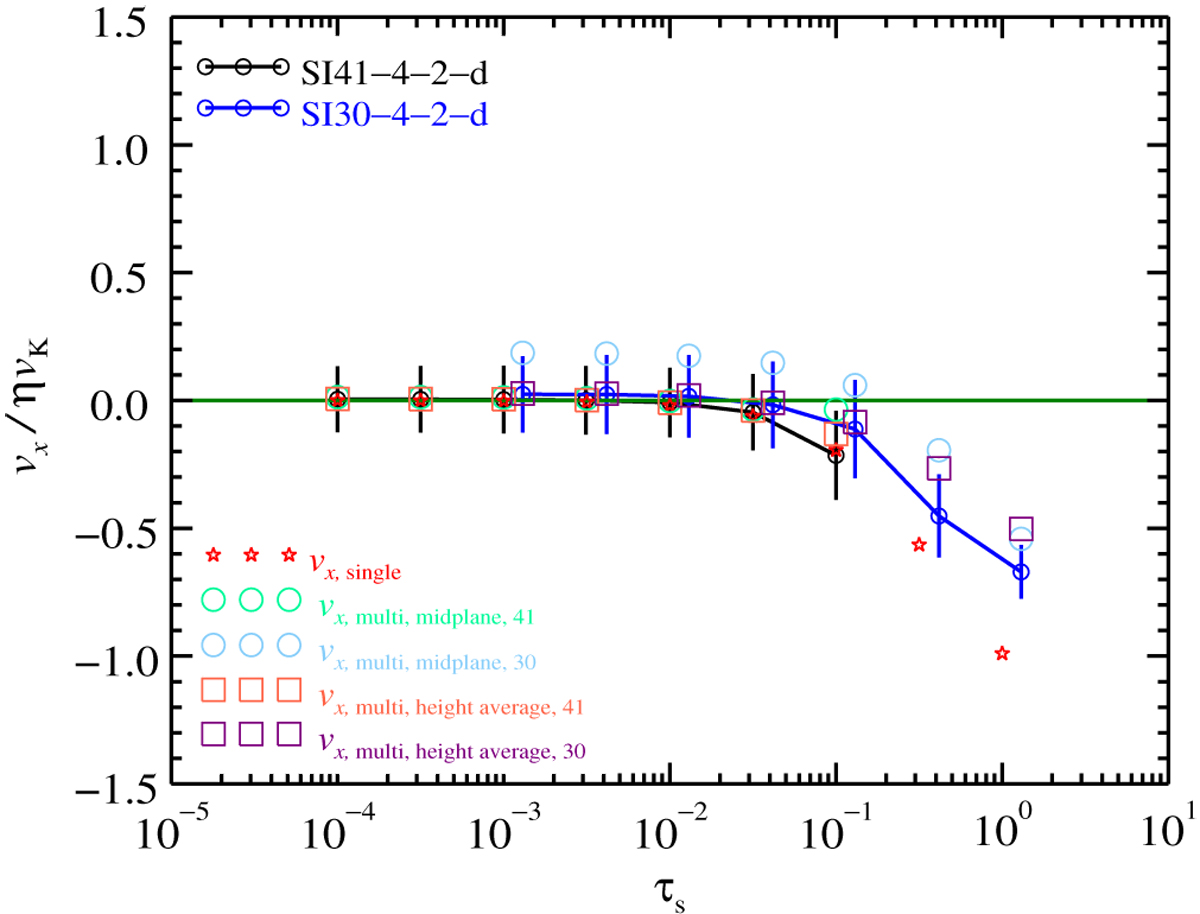
Mean equilibrium radial drift velocity as a function of Stokes number (τs) for runs SI41-4-2-d and SI30-4-2-d measured from the time of saturation. The vertical bars show the 1σ variation of the radial velocity and are measures of the radial diffusion each species experiences. The red stars represent the single species equilibrium solutions. The green and blue circles show the multispecies radial equilibrium velocity near the midplane. The purple and red squares show the height averaged multispecies solution under the assumption that the particle density of each species is distributed uniformly within its scale height. Run SI30-4-2-d was shifted horizontally for illustration purposes.
Current usage metrics show cumulative count of Article Views (full-text article views including HTML views, PDF and ePub downloads, according to the available data) and Abstracts Views on Vision4Press platform.
Data correspond to usage on the plateform after 2015. The current usage metrics is available 48-96 hours after online publication and is updated daily on week days.
Initial download of the metrics may take a while.