Fig. 6
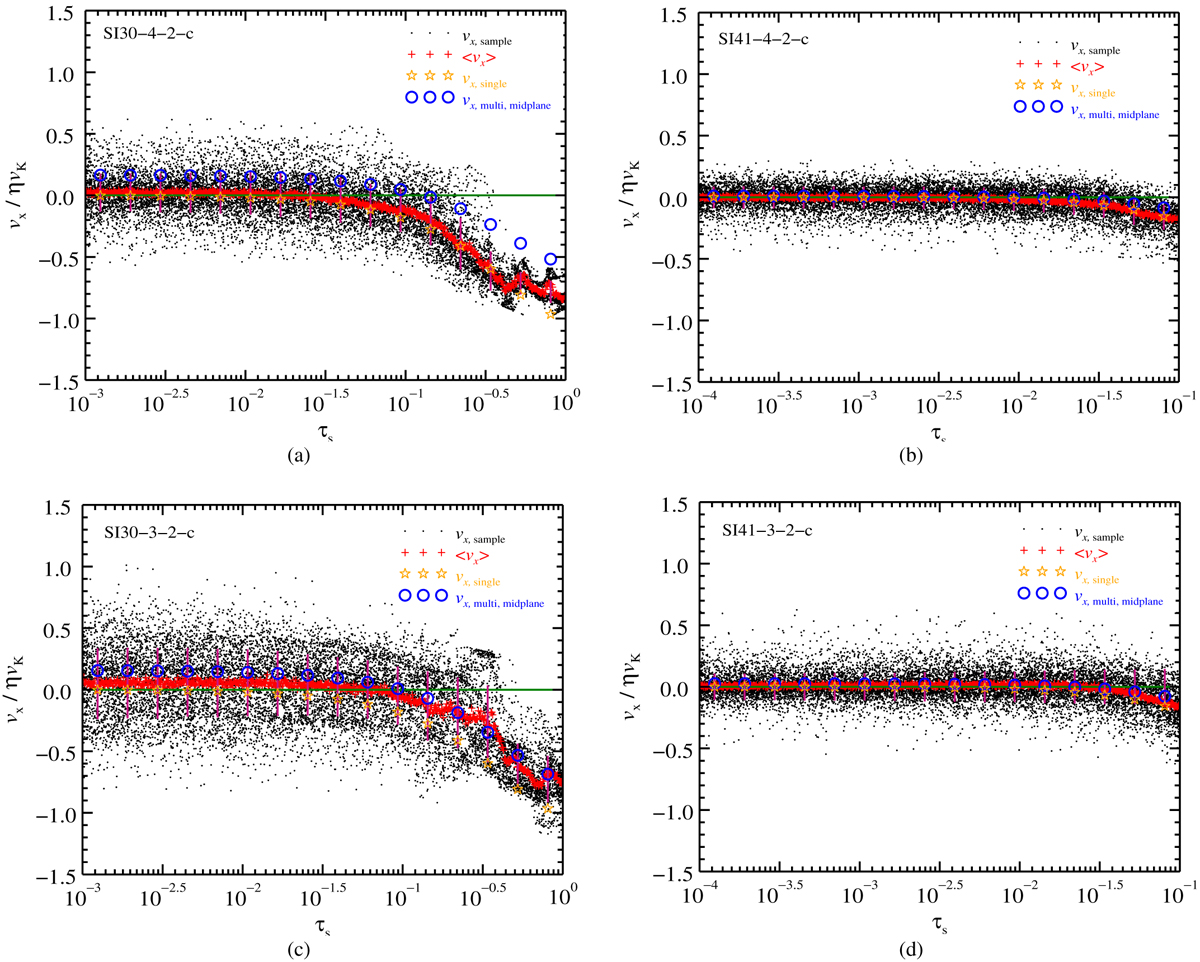
Radial drift velocity of runs SI30-4-2-c, SI41-4-2-c, SI30-3-2-c, and SI41-3-2-c in terms of Stokes number (τs) at t ≈ 1000 Ω−1. Individual black points show the radial drift velocities of a random subset of approximately 14 000 particles. The particle size distribution is continuous, such that each particle has a unique size and drift velocity. Each red cross shows the mean drift velocity of two hundred particles with similar τs, which decreases with increasing particle size. The dispersion of points around this mean shows the level of diffusion the particles experience, which goes down with increasing particle size as well. The purple bars show the 1σ variation around the mean velocity. The blue circles show the radial equilibrium velocity near the midplane for each particle species grouped into 16 bins using the multispecies NSH solution in Eq. (10). The theoretical velocity values provide a relatively good fit to the mean drift velocity for small particle sizes but are somewhat off for large Stokes numbers.
Current usage metrics show cumulative count of Article Views (full-text article views including HTML views, PDF and ePub downloads, according to the available data) and Abstracts Views on Vision4Press platform.
Data correspond to usage on the plateform after 2015. The current usage metrics is available 48-96 hours after online publication and is updated daily on week days.
Initial download of the metrics may take a while.