Fig. 1.
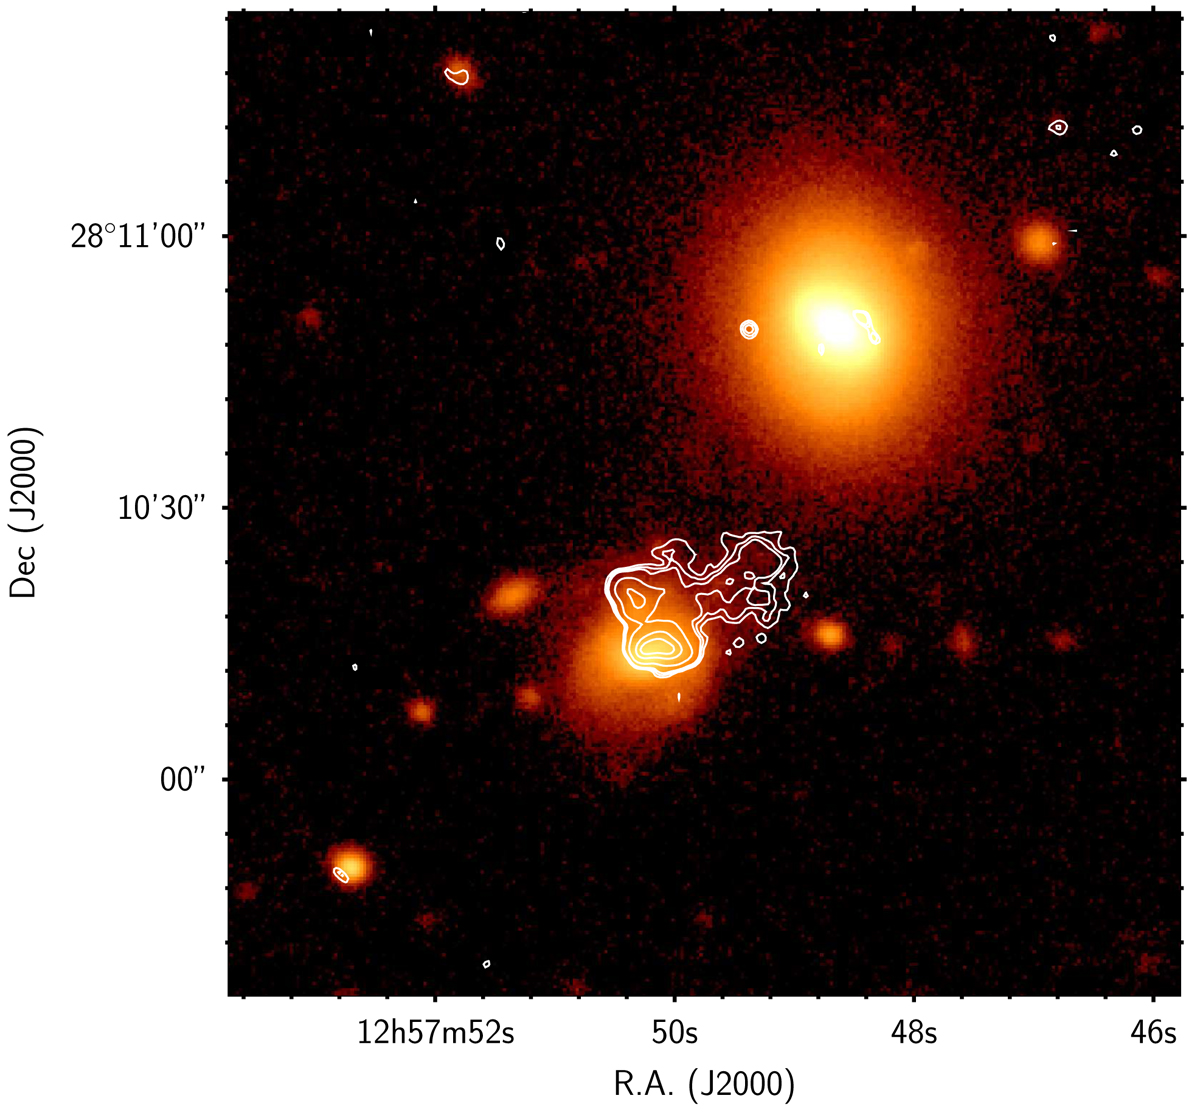
Grayscale representation of the r-band emission from J125750.2+281013. Contours represent the Hα NET emission. The proximity of the massive galaxy CGCG 160-049 does not allow us to exclude that the gaseous asymmetry is due to tidal interaction. However we note that stars appear not accordingly displaced. Levels are −17.07 −16.89 −16.29 −15.87 −15.69 erg cm−2 sec−1 arcsec−2 in log units, after three pixel Gaussian smoothing.
Current usage metrics show cumulative count of Article Views (full-text article views including HTML views, PDF and ePub downloads, according to the available data) and Abstracts Views on Vision4Press platform.
Data correspond to usage on the plateform after 2015. The current usage metrics is available 48-96 hours after online publication and is updated daily on week days.
Initial download of the metrics may take a while.