Free Access
Fig. 5.
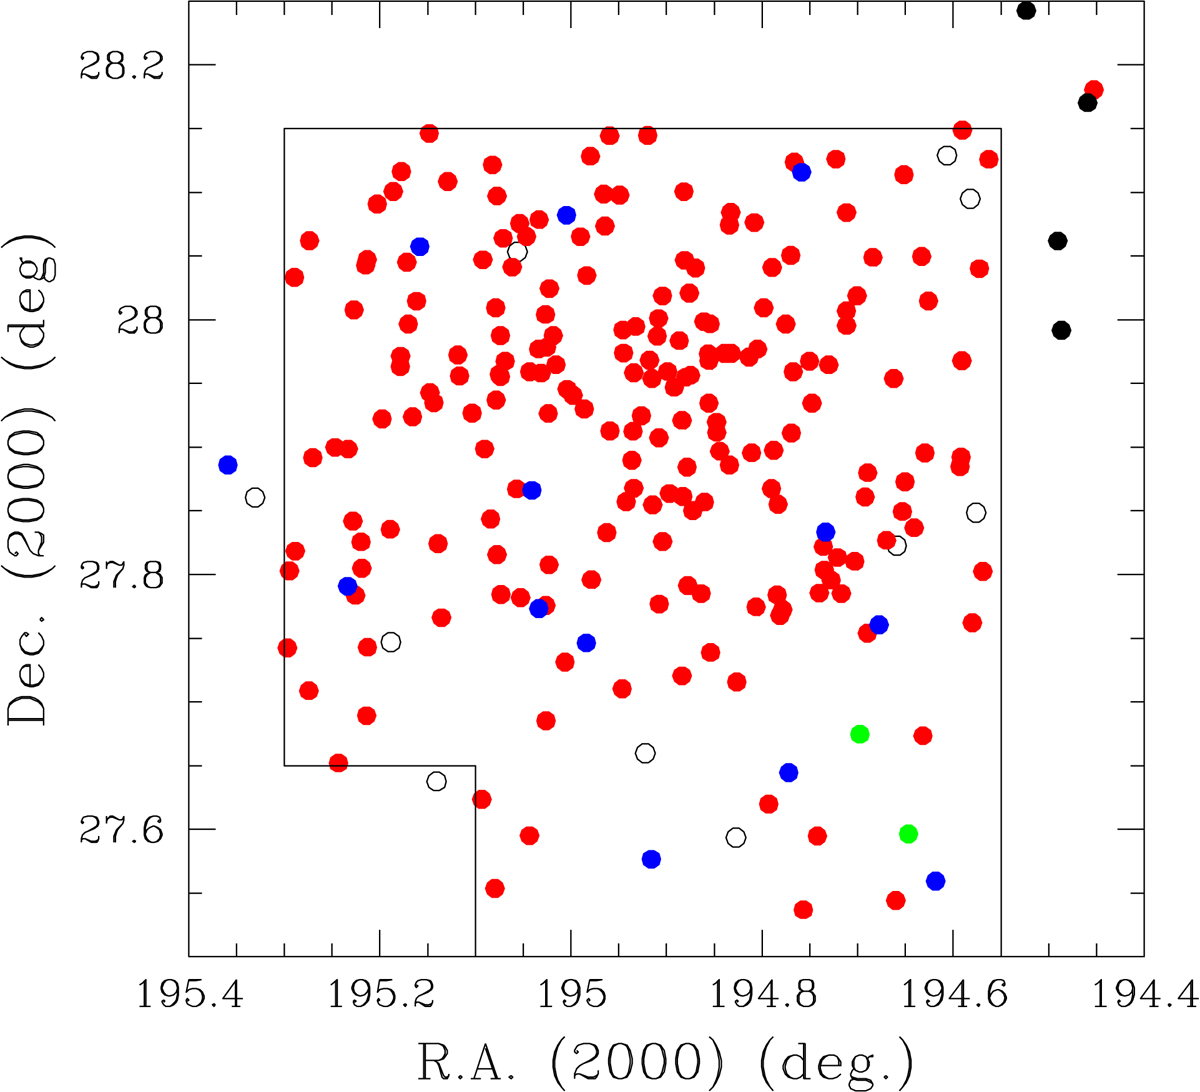
Sky distribution of the core of the Coma cluster surveyed in Hα by (Yagi et al. 2010; region within black lines), plus the 4 galaxies observed in this work or by Fossati et al. (2012; in the NW shown in filled black) and NGC4921 (Kenney et al. 2015 in the far E). Same symbols as in Fig. 4.
Current usage metrics show cumulative count of Article Views (full-text article views including HTML views, PDF and ePub downloads, according to the available data) and Abstracts Views on Vision4Press platform.
Data correspond to usage on the plateform after 2015. The current usage metrics is available 48-96 hours after online publication and is updated daily on week days.
Initial download of the metrics may take a while.