Fig. 6.
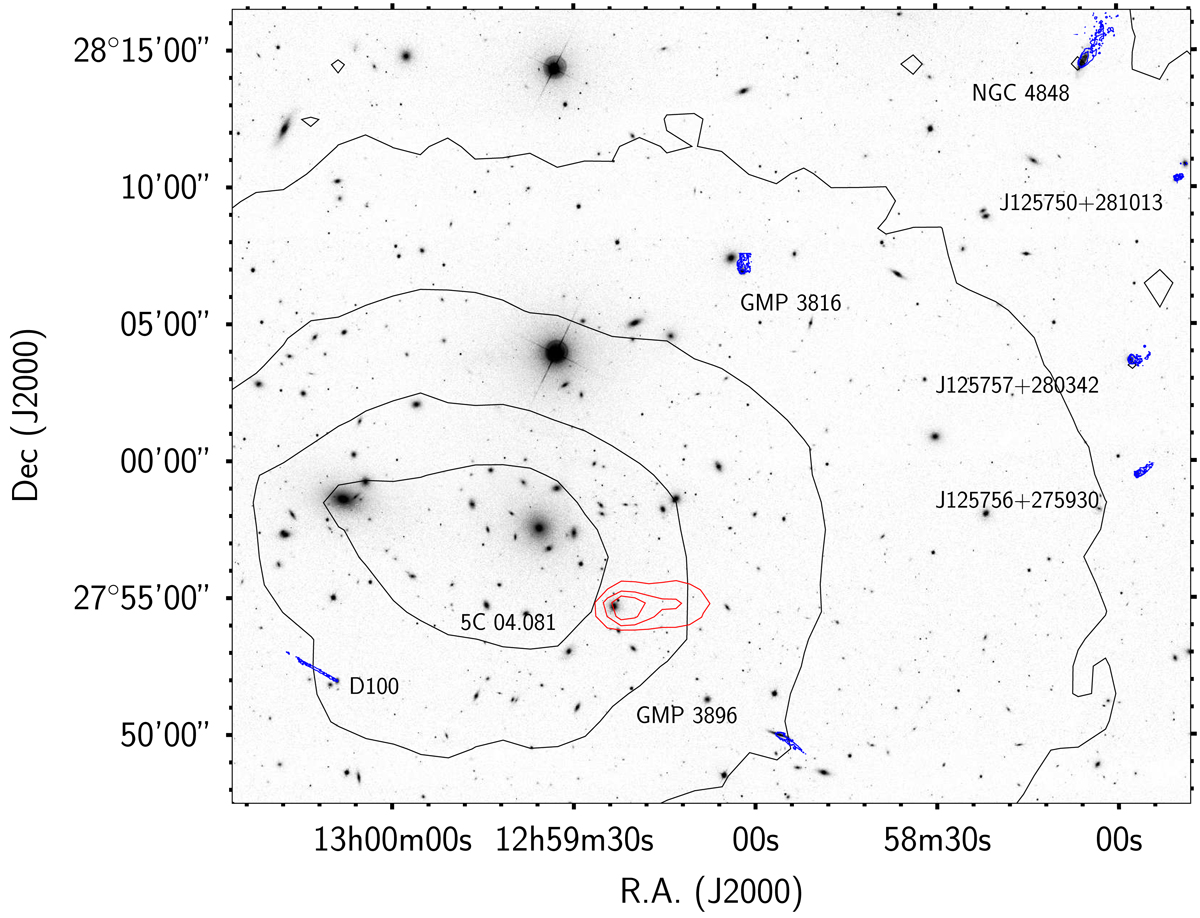
Grayscale representation of the distribution of galaxies in the NW part of the Coma cluster (from SDSS) to highlight the position of the newly discovered Hα tails. Black contours represent the X-ray emission (XMM 0.4–1.3 keV, contour levels: 10, 20, 50, 100, 150 cnts per second per square degree with a smoothing of 10 pixel). Red contours represent the radio emission from the head-tail radio source 5C 04.081. Blue contours show the Hα NET emission for NGC 4848 from this work, Yagi et al. (2010), and Fossati et al. (2012).
Current usage metrics show cumulative count of Article Views (full-text article views including HTML views, PDF and ePub downloads, according to the available data) and Abstracts Views on Vision4Press platform.
Data correspond to usage on the plateform after 2015. The current usage metrics is available 48-96 hours after online publication and is updated daily on week days.
Initial download of the metrics may take a while.